![]()
![]()
MF Visualization 3D Volume module provides interactive visualization of seismic 3D volumes by extracting and displaying inline, crossline, and time/depth slices. It enables rapid structural and stratigraphic interpretation, quality control, and anomaly detection by allowing users to navigate through the volume dynamically.
The module supports stepped slicing, animated sliding through the data, orientation control using azimuth angles, and amplitude thresholding to enhance features of interest.
![]()
![]()
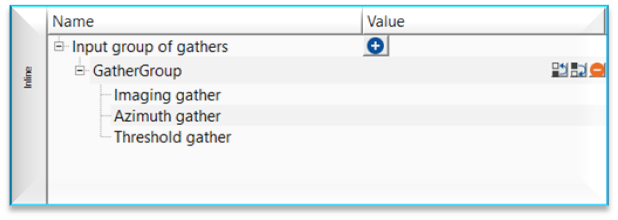
Input group of gathers - this should be post stack 3D volume. Connect/reference to the Output gather of Read seismic traces or any seismic data volume in post-stack. The load must be loaded to RAM in case the users uses "Read seismic traces/Read SEG-Y Traces" module for reading the data. Click on  icon. It will open up with Gather Group. Connect/reference Imaging gather to Output gather of Read SEG-Y/seismic traces module.
![]()
![]()
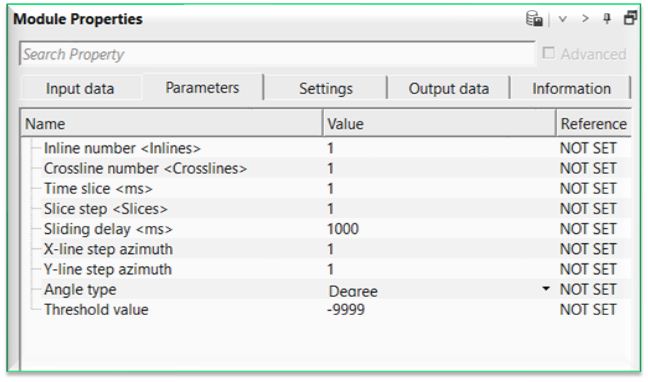
Inline number - specifies the inline index to display from the 3D volume. It automatically extracts the information once the user clicks "Load data" action item.
Crossline number - specifies the crossline index to display from the 3D volume. It automatically extracts the information once the user clicks "Load data" action item.
Time slice - defines the time or depth value at which a horizontal slice is extracted. By default, 1.
Slice step - controls the increment between successive slices when stepping through the volume. By default, 1. It works in such a way that, if the input data sample interval is 4ms then the slice step will be 4ms. It is like 4x1 = 4. In case the slice step is 25 then the next slice will be at 4x25 = 100.
Sliding delay - sets the time delay between slice updates during automatic or animated sliding. By default, 1000 ms.
X-line step azimuth - defines the azimuth angle used when stepping slices along the crossline direction.
Y-line step azimuth - defines the azimuth angle used when stepping slices along the inline direction.
Angle type { Degree, Radian } - specifies the unit used for azimuth angles. By default, Degree.
Degree - angles expressed in degrees
Radian - angles expressed in radians
Threshold value - sets an amplitude cutoff for visualization, suppressing values below or above the specified threshold.
![]()
![]()
Skip - By default, FALSE(Unchecked). This option helps to bypass the module from the workflow.
![]()
![]()
Output group of gathers - generates output gathers like time/depth slices along with inline and cross lines.
Number of crosslines - displays total number of crosslines of the volume.
Number of samples - displays the number of samples
Sample interval - displays the sample interval of the input volume.
![]()
![]()
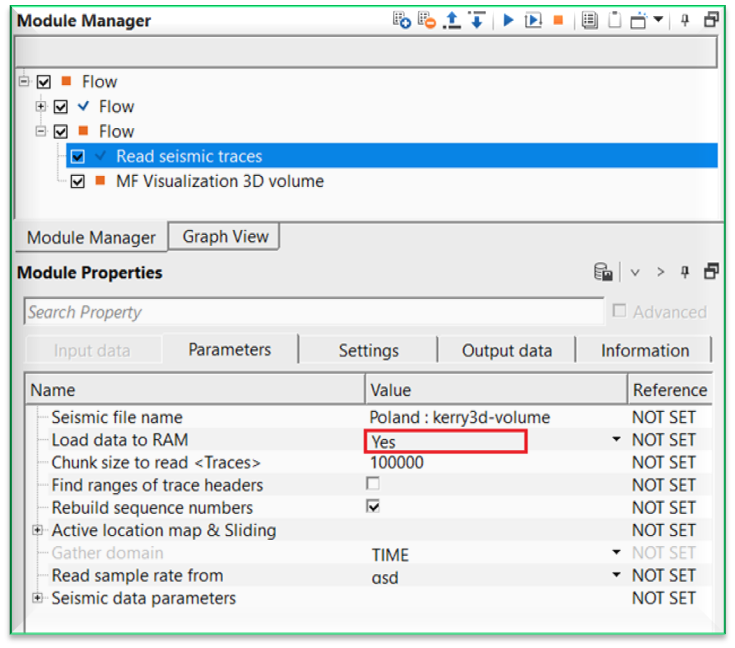
In this example workflow, we are reading a post-stack 3D volume by using "Read seismic traces". As we mentioned earlier, the data should be loaded to RAM. So change the parameter of Load data to RAM as YES from NO.
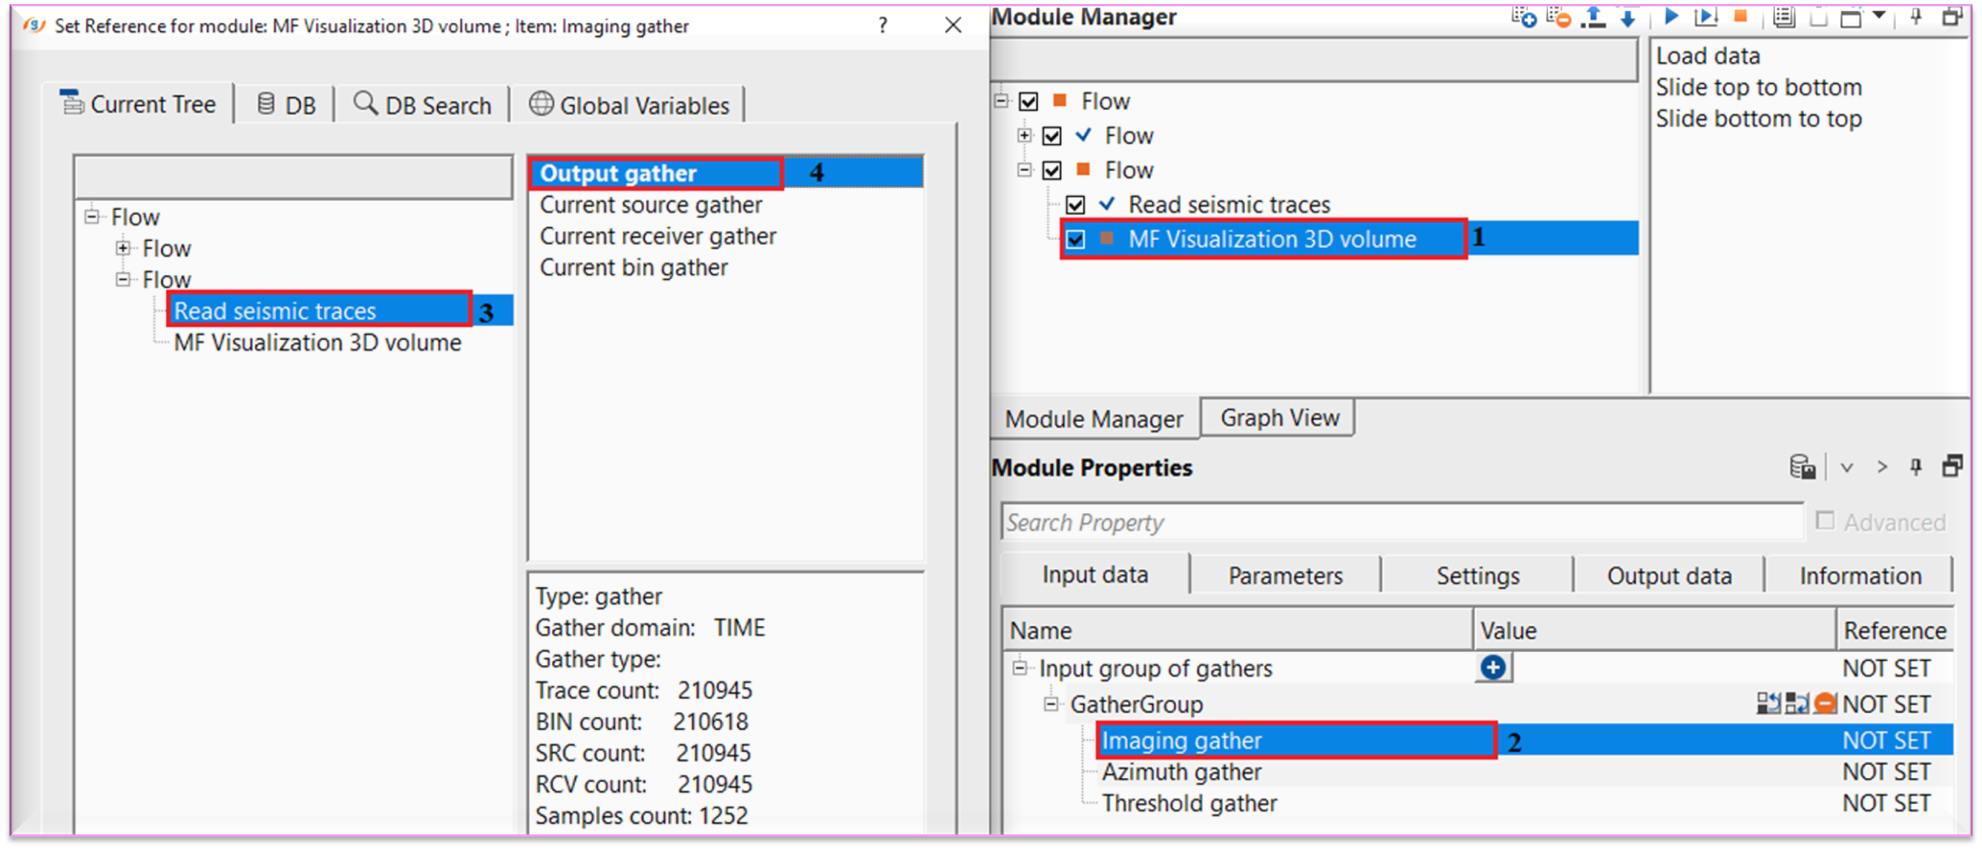
Connect/reference the Output gather of Read seismic traces module to Imaging gather of MF Visualization 3D volume module.
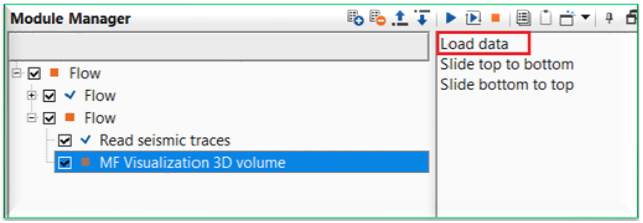
Once the reference/connections are done, the user should click on "Load data" action item. This action items loads the entire data volume and updates the Parameters information automatically.
After this, launch Vista Groups -> All Groups. There are few vista items like Inline, Crossline, Location map, IL/XL Location map appears.
On the Location map & IL/XL location map the user can click on anywhere/bin to display the contents of the seismic volume.
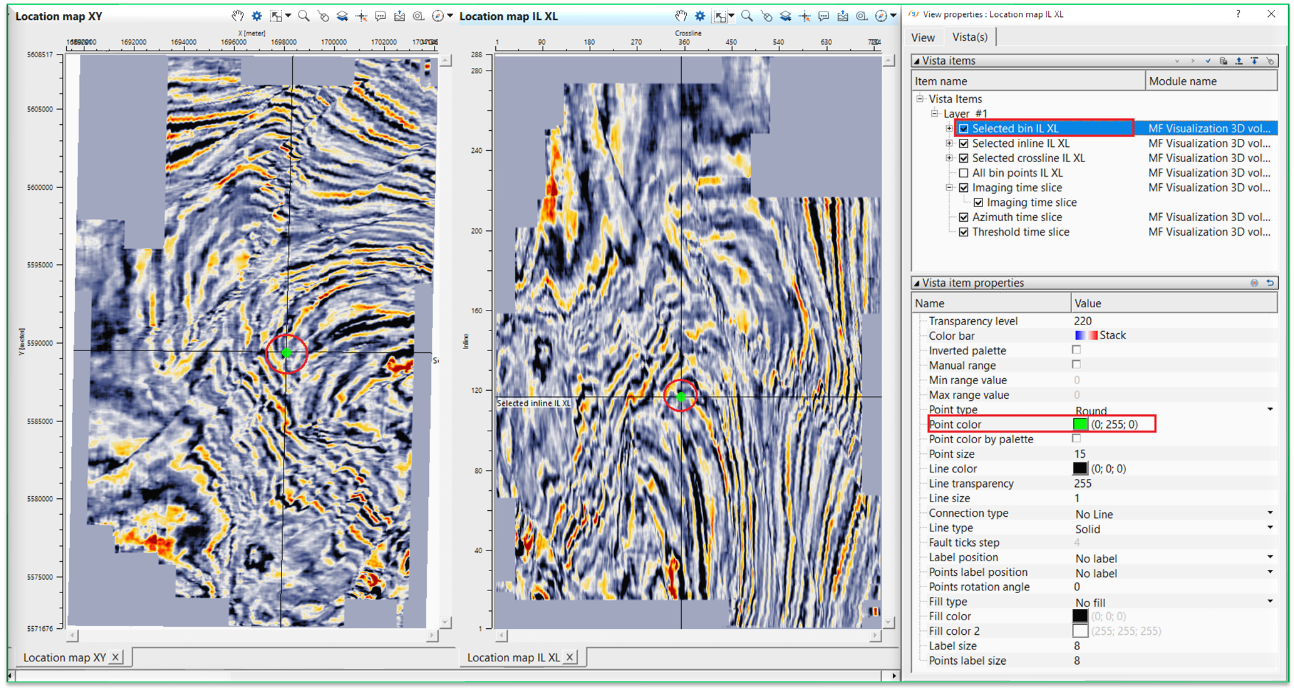
By default, Selected bin color is in White/Grey color. Open the View properties and select Selected bin IL/XL and change the point color as shown above.
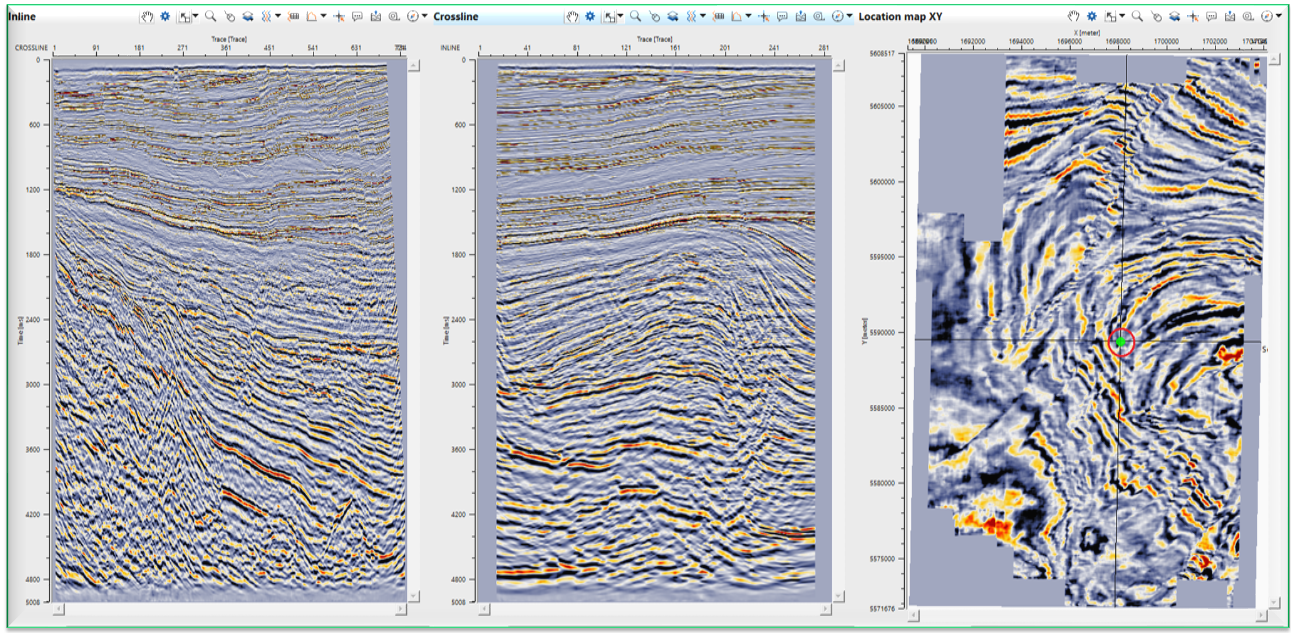
The user can change the inline/crosslines manually also. Go to Parameters tab and input the desired inline/crossline numbers.
In case the user wants to animate the time/depth slices, go to Action items panel and click on "Slide top to bottom" or "Slide bottom to top"
![]()
![]()
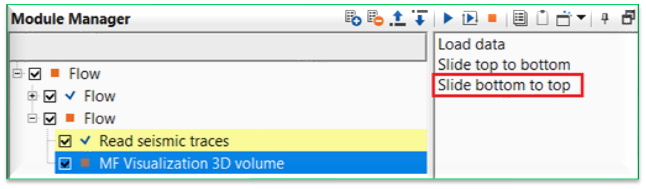
Load data - after inputting/reading the input data, the user must click this option to load the entire data volume.
Slide top to bottom - this option allows the user to slide the time/depth slices from top to bottom.
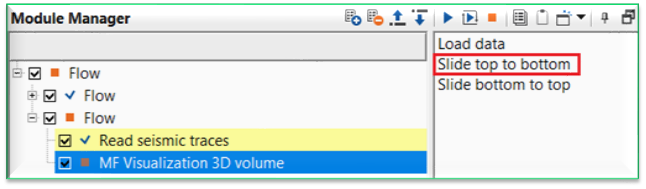
Slide bottom to top - this option allows the user to slide the time/depth slices from bottom to top.
![]()
![]()
YouTube video lesson, click here to open [VIDEO IN PROCESS...]
![]()
![]()
Yilmaz. O., 1987, Seismic data processing: Society of Exploration Geophysicist
 * * * If you have any questions, please send an e-mail to: support@geomage.com * * *
![]()