Amplitude-frequency characteristics calculation
![]()
![]()
Spectral Analysis evaluates the frequency content of seismic traces or gathers to support QC, parameter selection, and interpretation. It is commonly used to assess bandwidth, identify noise, guide filter design, and validate processing steps such as deconvolution, correlation, and enhancement.
The module computes spectra (or time–frequency attributes) over user-defined windows and displays results in normalized, decibel, or absolute amplitude scales. Optional picking and muting tools allow focused analysis of specific frequency bands or time intervals.
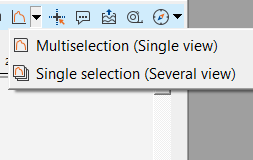
In case the user wants to perform spectral analysis from the Input gather window, spectral analysis window. There are two options available next to the icon ![]() . Click on the triangle and it will display two options. Multi selection and Single selection.
. Click on the triangle and it will display two options. Multi selection and Single selection.
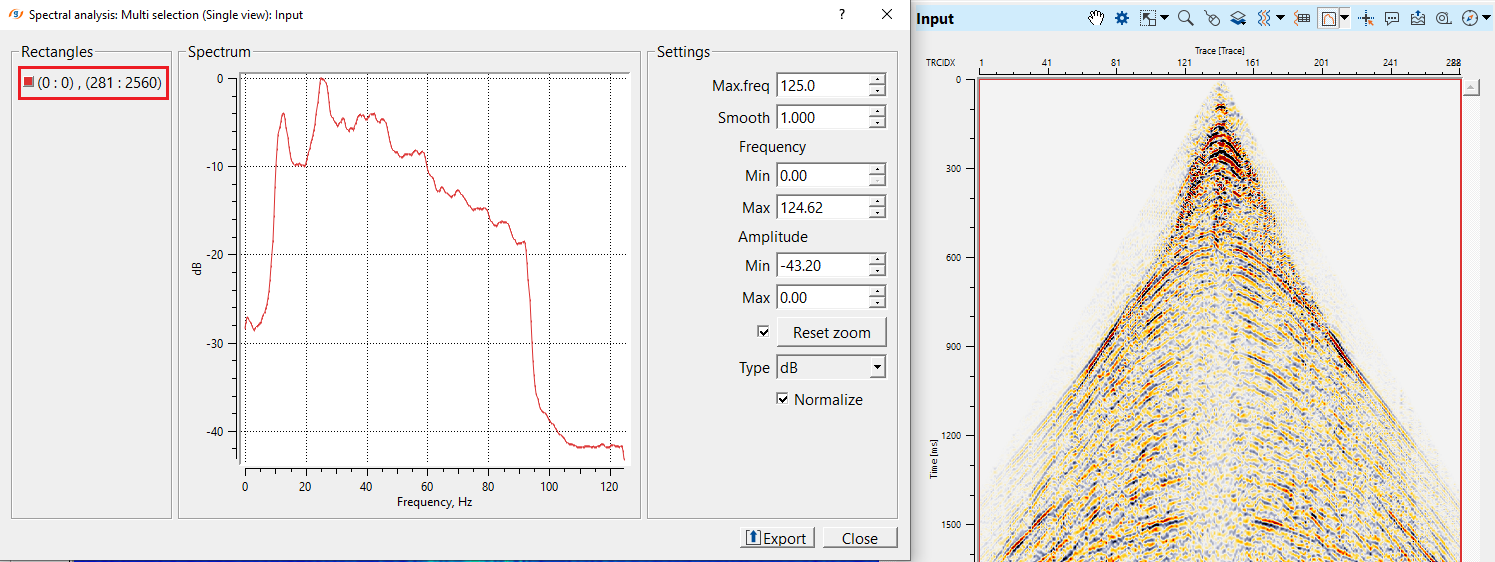
Multi selection (Single view) - By clicking this first time, it will select the entire gather and displays the spectrum. If we observe, on the spectral analysis window, we've (0:0), (281:2560)
These are nothing but from trace index 0 to 281 and time starting from 0 to 2560.
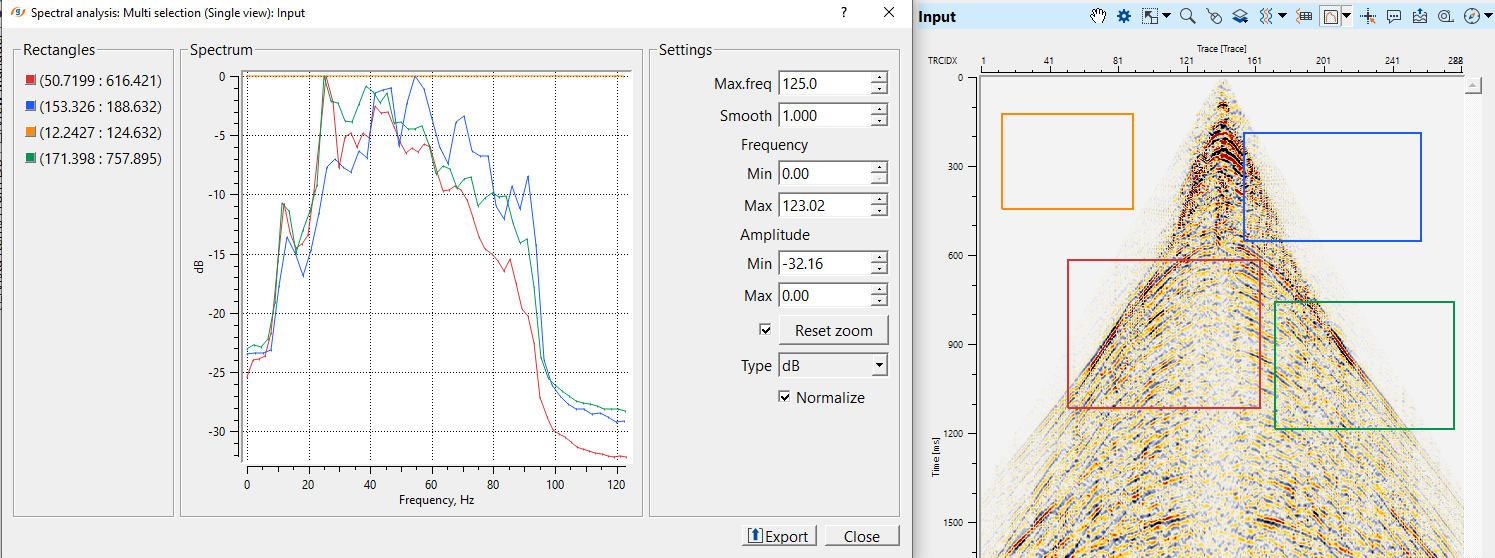
If the user wants to analyze the spectrum at different places of the input gather, the user should simply draw the rectangles/squares as many as they want. It will display multiple spectrum(s) with different colored boxes as shown below.
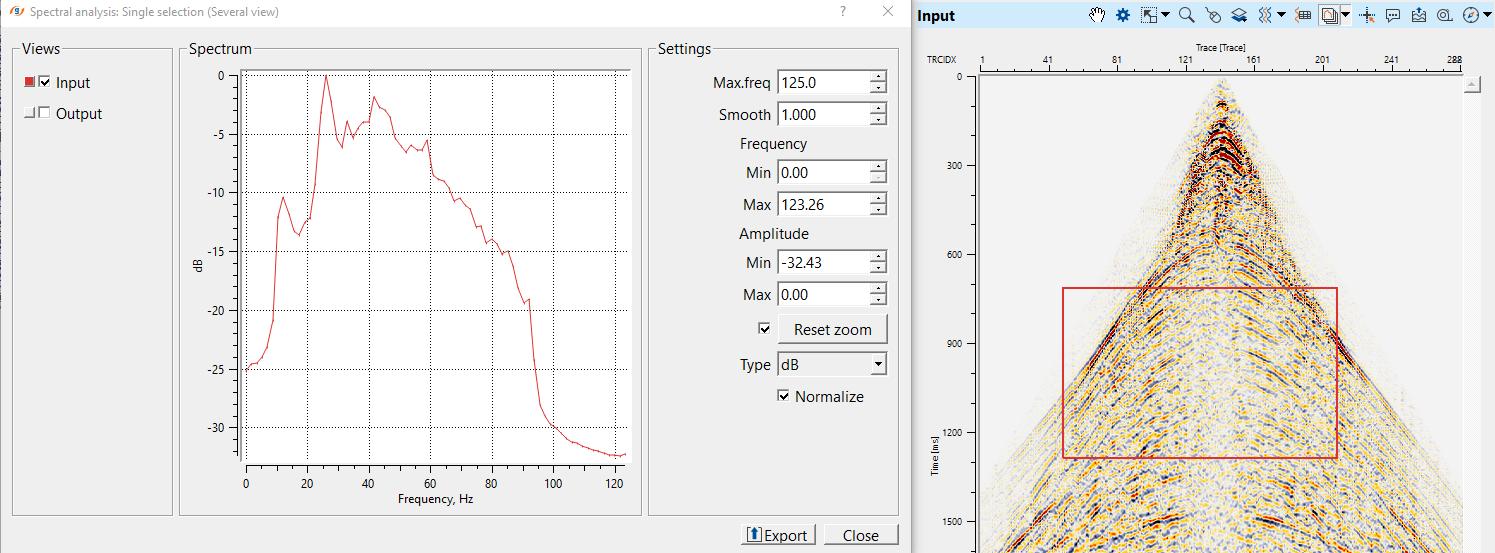
Single selection (several views) - in this option, it will display only one spectrum of the user selected window region. By default, it will select the entire gather at first.
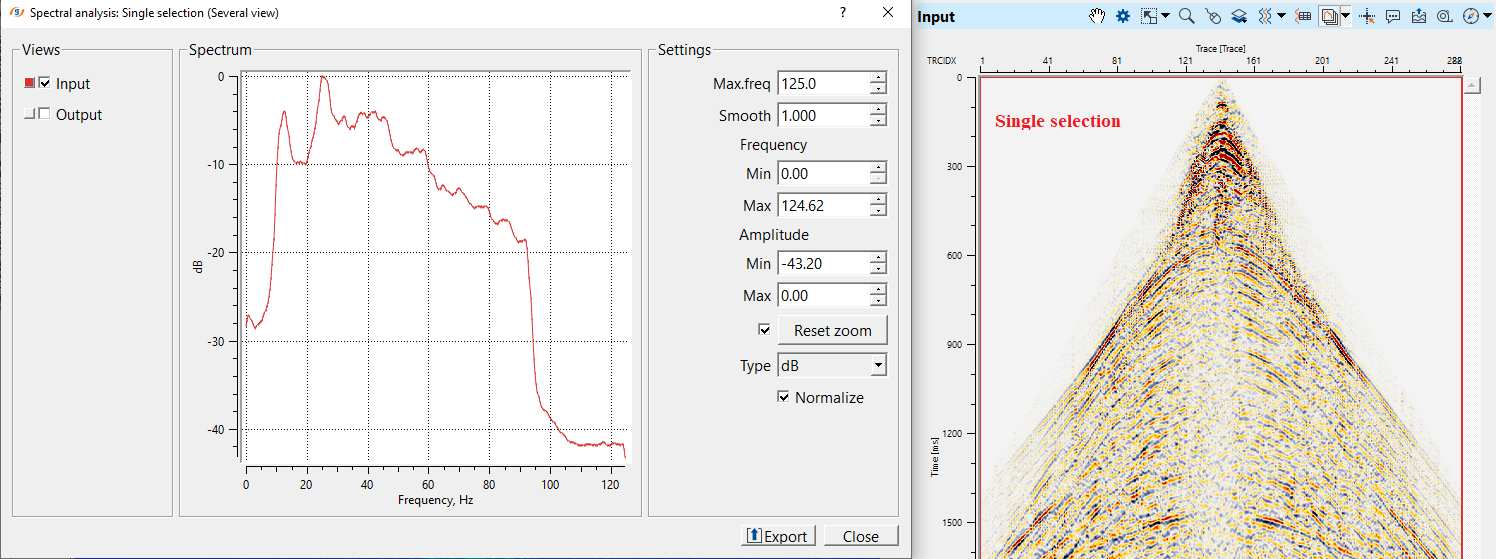
Next time, if the user wants to analyze a different area, simply choose the area and draw the rectangle/square and it will display the spectrum of that particular area only unlike the multiple selection option. The previous window will automatically disappear.
![]() There is also an option for the user to move the same analysis window freely by placing the cursor inside the analysis window and hold it with MB1 or LMB. It will display a handle symbol
There is also an option for the user to move the same analysis window freely by placing the cursor inside the analysis window and hold it with MB1 or LMB. It will display a handle symbol ![]() . Just hold it and move the window wherever the user wants. Simultaneously, the spectrum also changes as we move.
. Just hold it and move the window wherever the user wants. Simultaneously, the spectrum also changes as we move.
![]()
![]()
Mute picking - in case the user wants to add mute, connect/reference to Mute picking item either from any of the mute module(s), Load item (if mute item was saved as an item), Stack Imaging module (where mute is picked on NMO gather) etc. This parameter is optional.
Input gather - connect/reference to the input gather. This input gather can be any gather (shot/receiver/cmp) or stack.
Muted gather - connect/reference to the Muted gather. This is also optional.
![]()
![]()
Maximum length of correlation - the analysis windows slides along a trace and determines the amplitudes and frequencies at each window location. These values are used to produce the spectrum graph
Smooth window - smooths spectrum curve. Higher values produce smoother spectrum
Normalization mode { Normalized, Db, Amplitude } - specifies how spectral amplitudes are scaled for display and comparison. By default, Normalized.
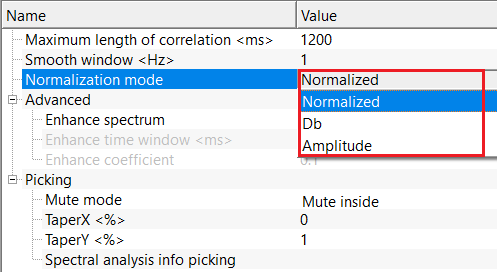
Normalized - scales amplitudes to a common reference value like 1 (maximum). Best for relative bandwidth comparison across traces/gathers.
Db - converts amplitudes to decibels (log scale). Best for dynamic range analysis and weak-signal visibility.
Amplitude - displays absolute linear amplitudes. Best for true energy comparison and quantitative QC.
Advanced -
Enhance spectrum - this option allows the user to enhance the spectrum. By default, FALSE (Unchecked).
Enhance spectrum - true - if TRUE (Checked), provide the parameters for enhancing the spectrum.
Enhance time window - Defines the time interval where spectral enhancement is applied. Limits enhances to zone of interest where user defined the time window.
Enhance coefficient - Strength of spectral enhancement (gain) applied within the enhance time window. Low values improves clarity and higher values amplifies the noise. Careful parametrization is needed.
Picking - Spectrum calculation mode.
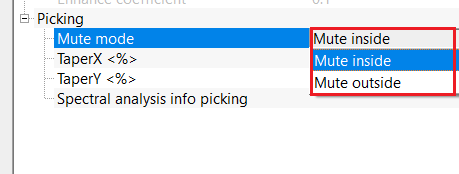
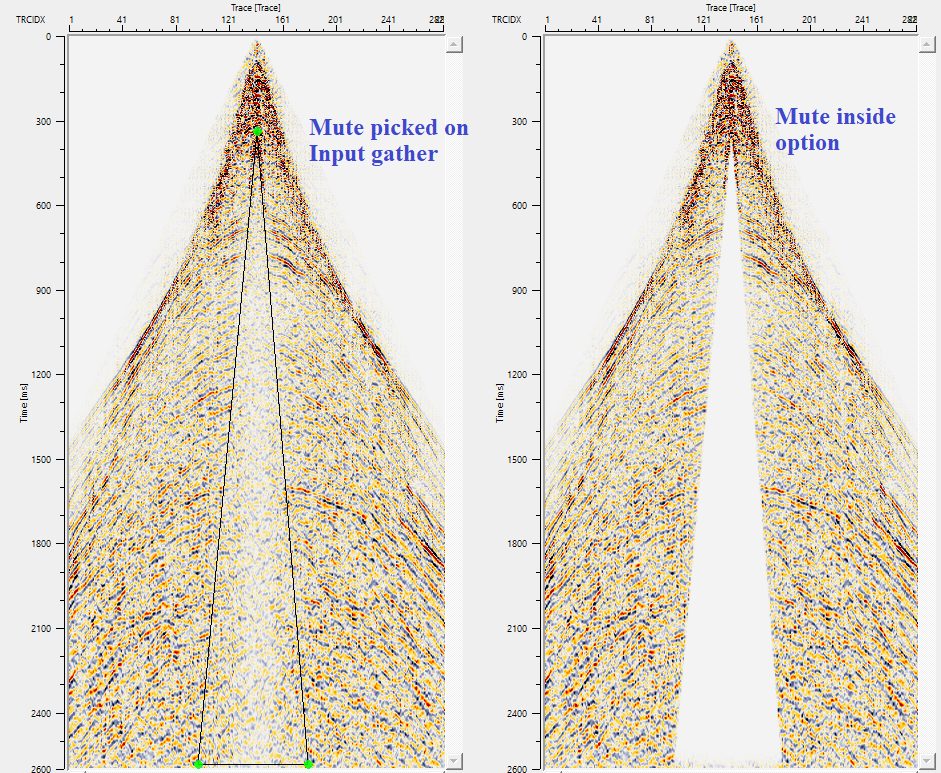
Mute mode { Mute inside, Mute outside } - There are 2 modes of spectrum calculation inside the picked window:
Mute Inside - the calculation of spectrum characteristic is performed for the data that are outside the marked area
Mute Outside - the calculation of spectrum characteristic is performed for the data that are inside the marked area
TaperX - Size of taper zone in x-direction
TaperY - Size of taper zone in y-direction
Spectral analysis info picking - full path and name of picking file in area of spectral analysis
![]()
![]()
Number of threads - One less than total no of nodes/threads to execute a job in multi-thread mode. Limit number of threads on main machine.
Skip - By default, FALSE(Unchecked). This option helps to bypass the module from the workflow.
![]()
![]()
F-X spectrum gather - outputs F-X spectrum gather as an output.
There is no information available for this module.
![]()
![]()
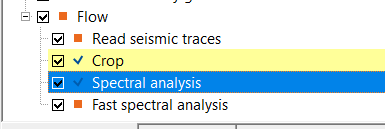
In this example workflow, we perform spectral analysis of a shot gather. Spectral analysis can be performed on any gather or stack section.
Adjust the parameters as per the data requirement.
User has the option to apply mute and calculate the spectral analysis on the muted gather.
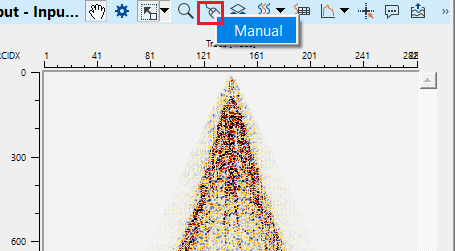
To pick a mute, go to Input gather window and select Manual option from Control item icon ![]() .
.
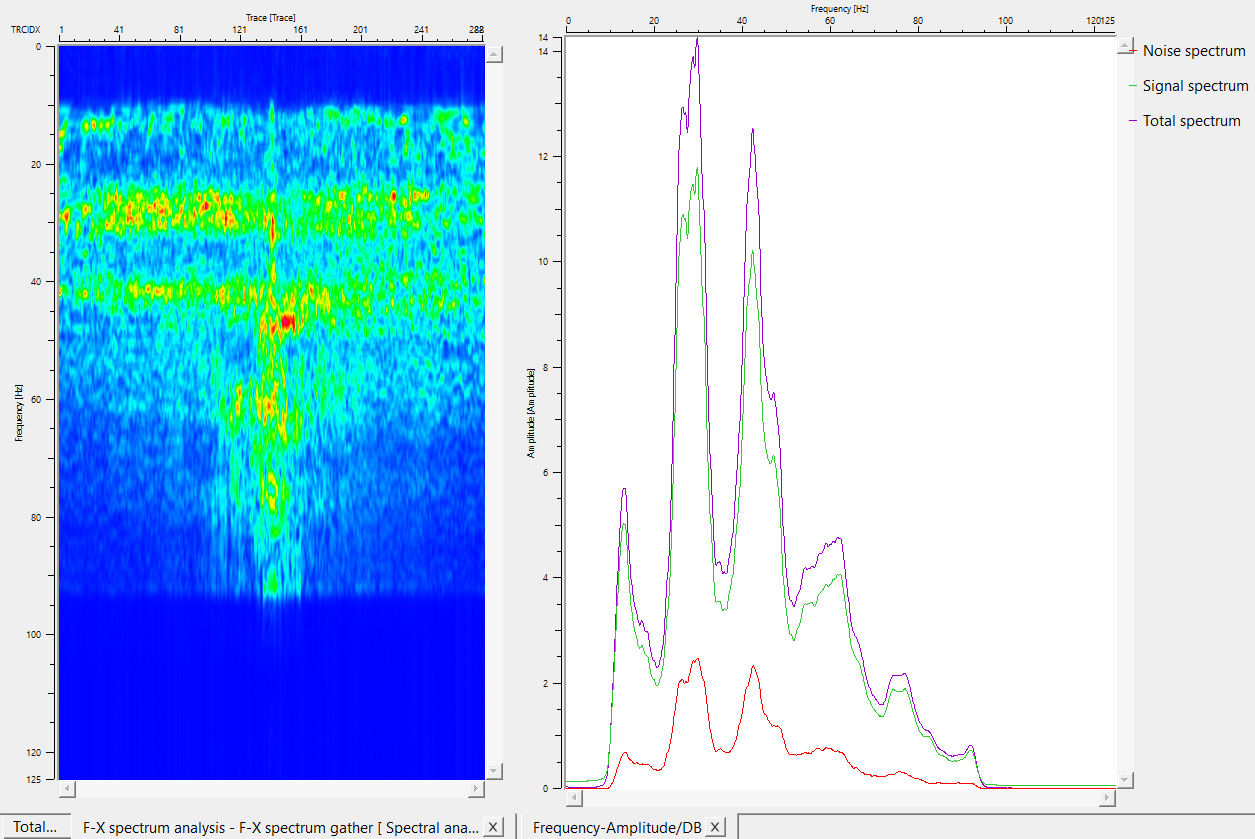
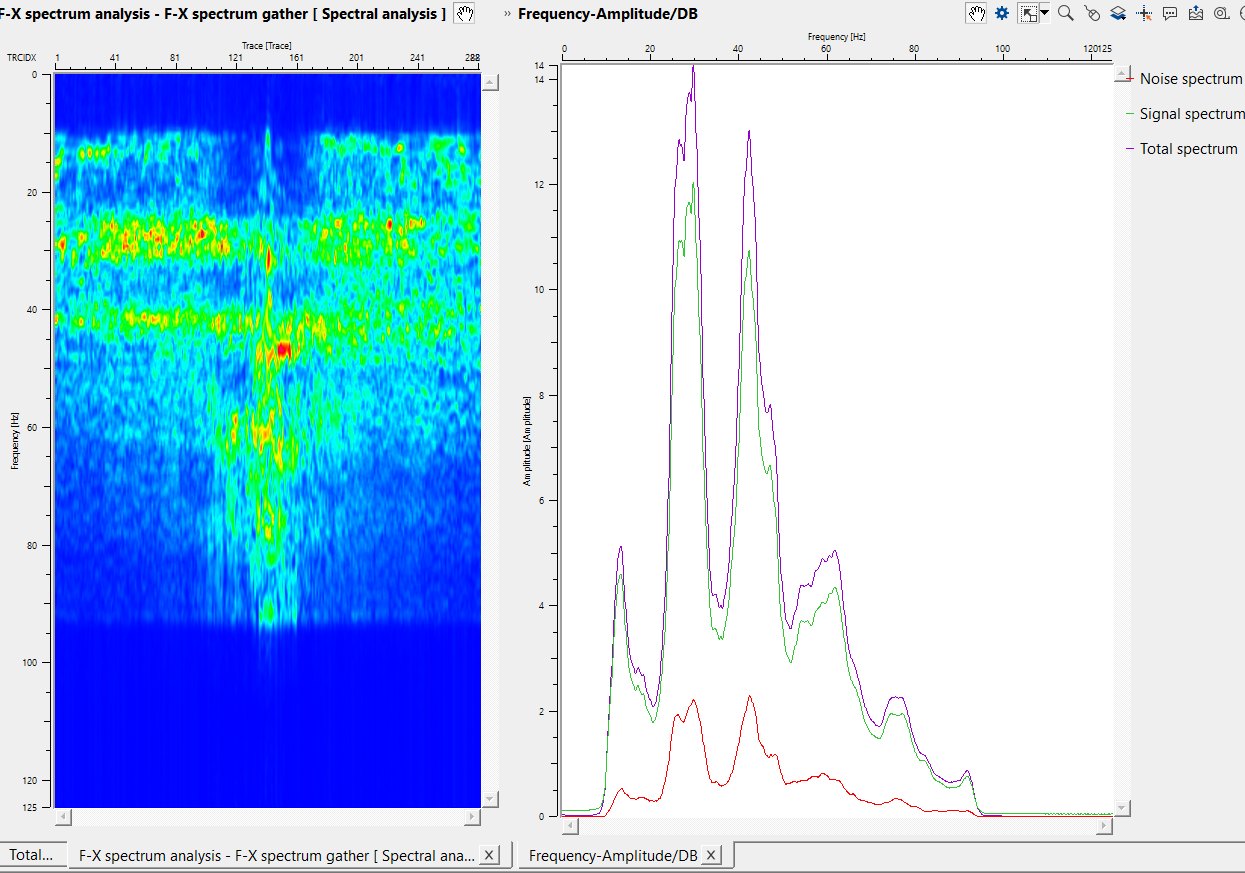
Check the spectral analysis (F-X spectrum & Frequency-Amplitude displays)
![]()
![]()
Clear all picking - it will clear all the mute picks.
Load picking - it allows the user to import the mute picking item
Save picking - it allows the user to save the picked mute item.
![]()
![]()
YouTube video lesson, click here to open [VIDEO IN PROCESS...]
![]()
![]()
Yilmaz. O., 1987, Seismic data processing: Society of Exploration Geophysicist
 * * * If you have any questions, please send an e-mail to: support@geomage.com * * *