Quality Checking of seismic data (trace headers)
![]()
![]()
Seismic data holds lot of information in the trace headers. It is always advisable to do a thorough quality checks before moving to the next step. Right from reading the data into the internal format, the user MUST do the quality checks at every stage to avoid any wrong doings or missing critical information.
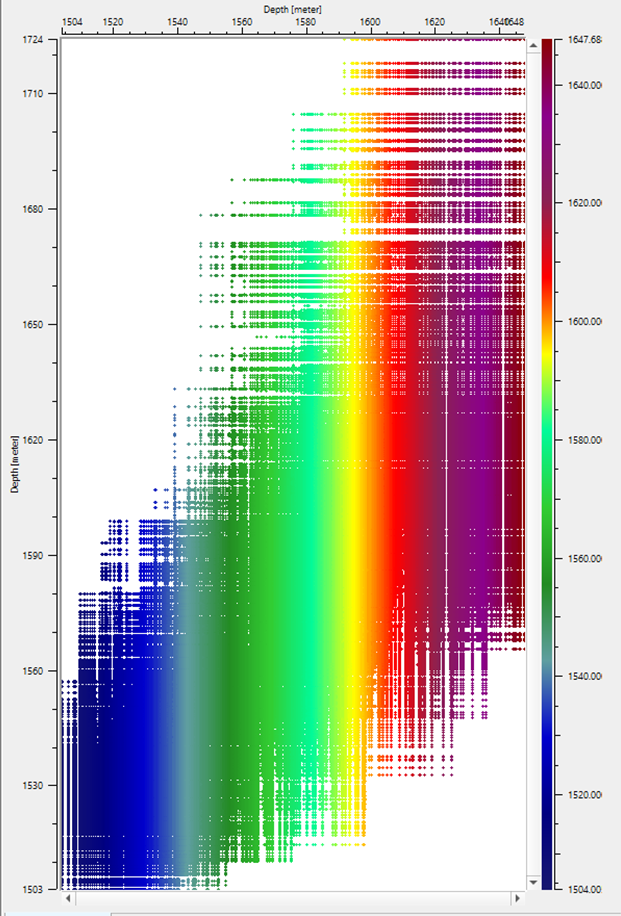
At every stage of the seismic data acquisition or processing, QC Trace Geometry plays an important role in data quality checks.This procedure shows the geometry of seismic data, allows to check the correctness of geometry assignment to trace headers.The user can build a cross plot of the data distribution or to access a table of trace headers.
![]()
![]()
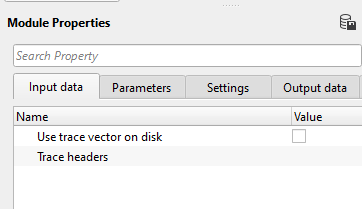
Use trace vector on disk
UseTraceVectorOnDisk - false - By default, FALSE. This is applicable when there is a large size dataset is read using "Open seismic traces" then the user can check this option and connect/reference to Output traces data handle.
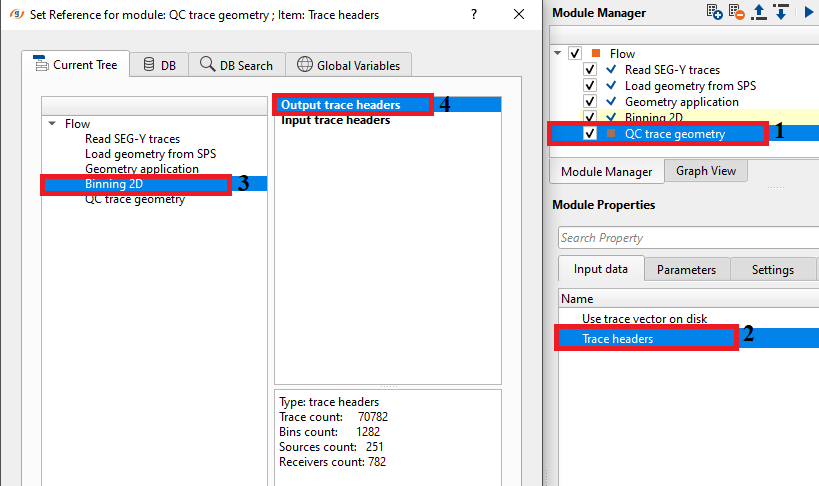
Trace headers - Connect/reference to the Output trace headers of the specific module. In this exercise, we are connecting/referencing to Output trace headers of Binning 2D module. This can be used at any stage of the seismic data processing/acquisition wherein the trace headers must be available.
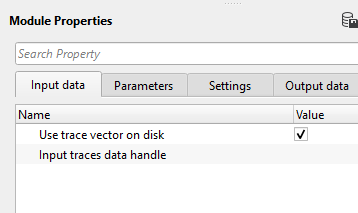
UseTraceVectorOnDisk - true - This option applicable when the data size is too big to read by "Read seismic traces" module to optimize the memory, we rather use "Open seismic traces" and connect/reference the output traces data handle.
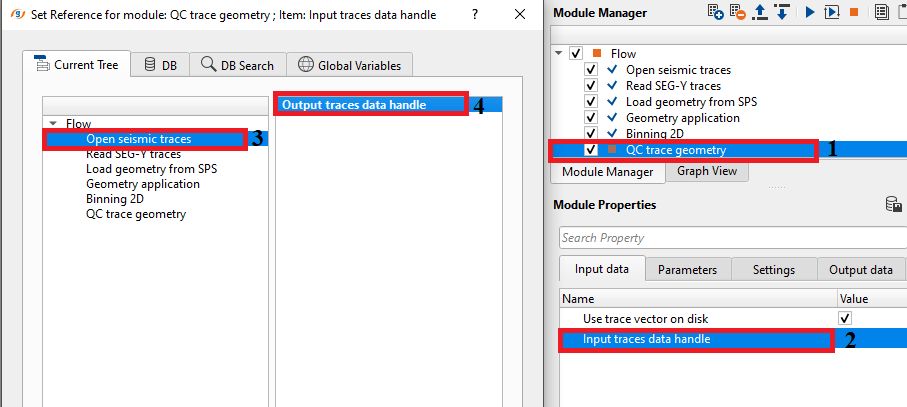
Input traces data handle - Connect/reference to Output traces data handle of "Open seismic traces".
![]()
![]()
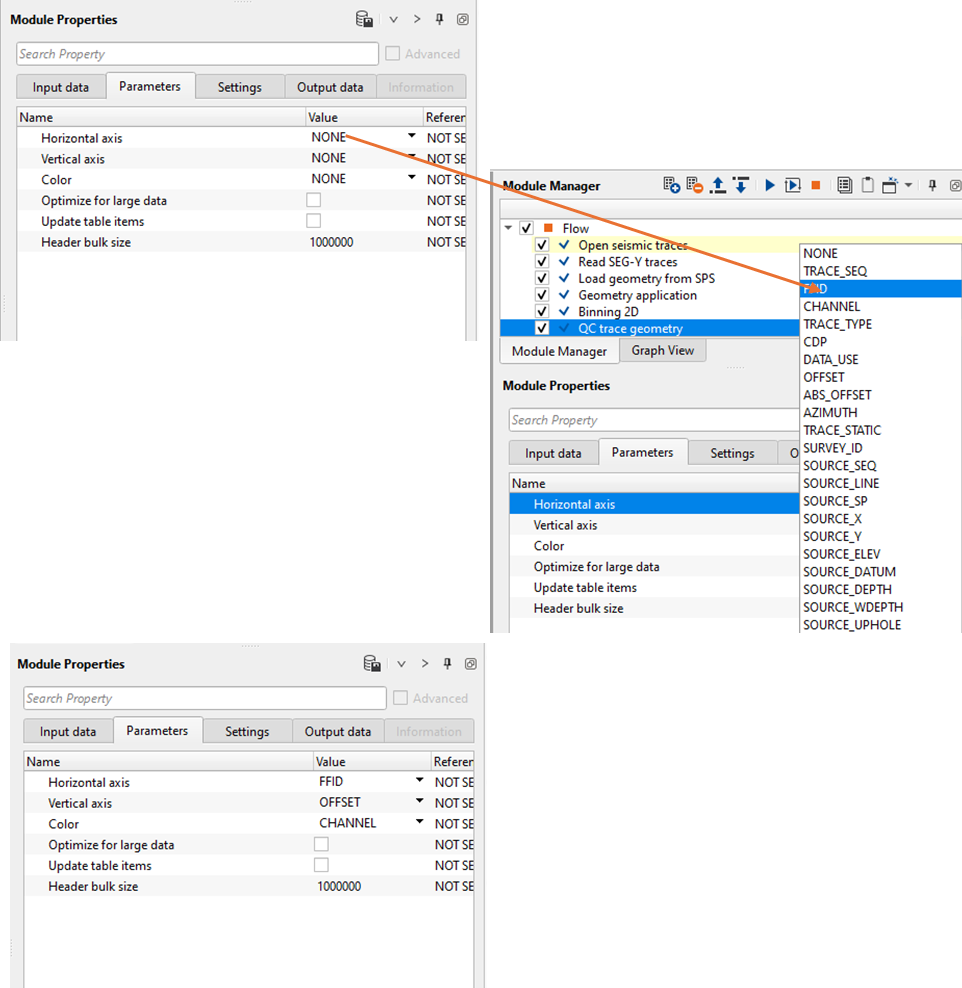
Horizontal axis - Choose the trace header to be plotted along the horizontal axis from the drop down menu.
Vertical axis - Choose the trace header to be plotted along the vertical axis from the drop down menu.
Color - This optional, however if the user wants to any trace header to display the plot in more graphical way then this particular header value will display the plot in colors. It is depending on the variability of the trace header value.
Optimize for large data - By default, FALSE. When this option is enabled, the module bins all data points into a grid defined by the horizontal and vertical chunk counts, and displays the average value per cell. This avoids rendering millions of individual scatter points in the cross-plot viewer, making it practical to QC very large datasets. Enable this option whenever the full point-by-point scatter plot would be too slow to display or interact with. When enabled, the Number of horizontal axis chunks and Number of vertical axis chunks sub-parameters become visible.
Number of horizontal axis chunks - By default, 5000. Controls the number of grid cells along the horizontal axis when Optimize for large data is enabled. The entire range of the selected horizontal header value is divided into this many equally spaced bins. Use a larger value to preserve more spatial detail in the cross-plot; use a smaller value to reduce memory usage and rendering time.
Number of vertical axis chunks - By default, 5000. Controls the number of grid cells along the vertical axis when Optimize for large data is enabled. The entire range of the selected vertical header value is divided into this many equally spaced bins. Adjust together with Number of horizontal axis chunks to balance display resolution against performance.
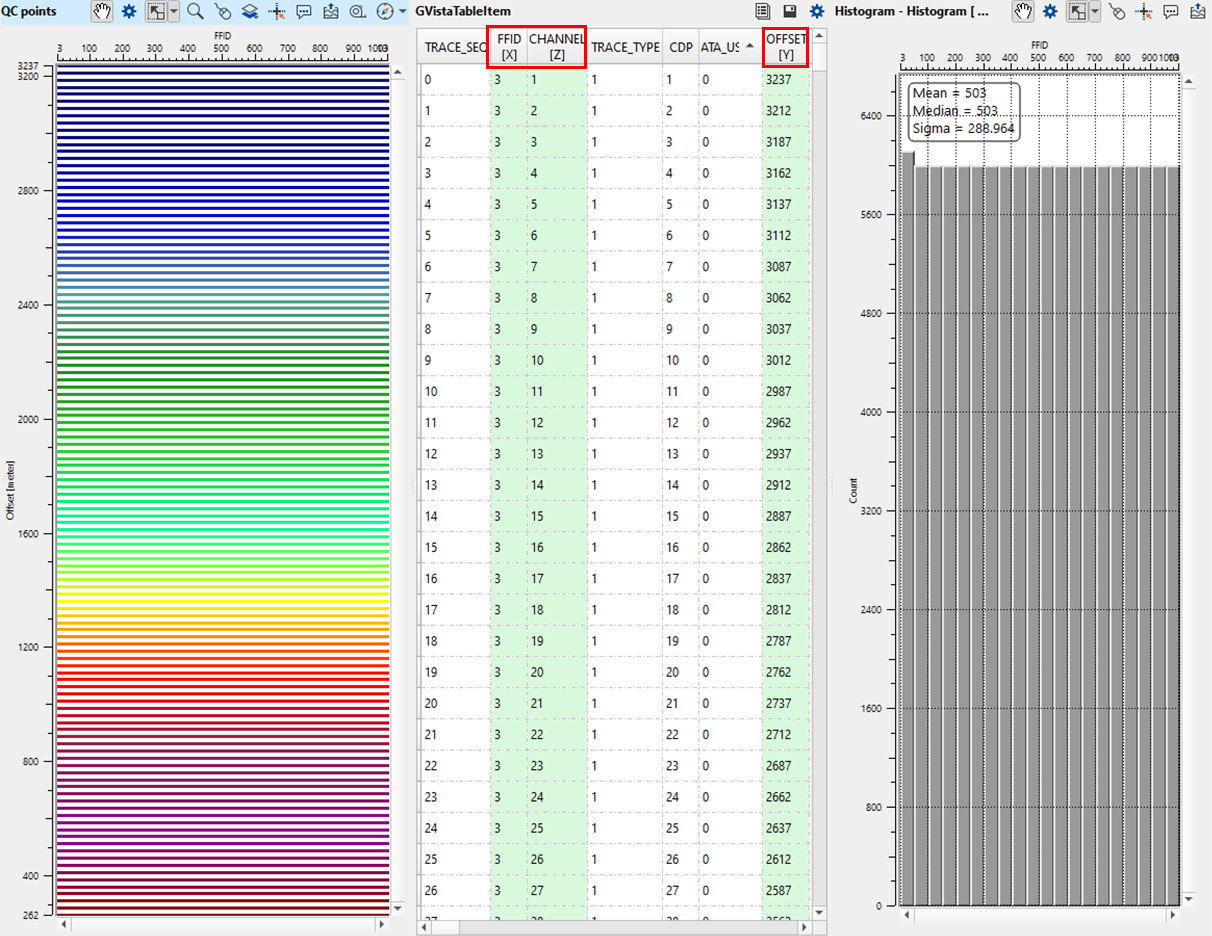
Update table items - Depending on the user selected trace headers as horizontal, vertical and color axes, the table automatically changes which trace headers. For example, if the horizontal axis is FFID, Vertical axis is OFFSET & Color is CHANNEL then these 3 columns will be highlighted in the table of the QC trace geometry vista items, however if the user changes the Horizontal axis from FFID to CDP then the table will display the CDP column in the table as horizontal axis (X).
![]() Please be cautious with this option when the input data size is too big. It will slow down the performance. It is advisable not to Check (TRUE) this options unless it is necessary.
Please be cautious with this option when the input data size is too big. It will slow down the performance. It is advisable not to Check (TRUE) this options unless it is necessary.
Header bulk size - By default, 1,000,000. Applies only when Use trace vector on disk is TRUE. This value specifies how many trace headers are read from disk into memory at one time. Larger values read more headers per pass, which can be faster on systems with sufficient memory. Reduce this value if the system runs low on memory when processing very large datasets.
![]()
![]()
Number of threads - One less than total no of nodes/threads to execute a job in multi-thread mode.
Skip - By default, FALSE(Unchecked). This option helps to bypass the module from the workflow.
![]()
![]()
Tables - This module generates the trace headers values in a tabular format. The user can export this table by using "Export table" module or connect/reference this table for any module which requires tabular information. Each column represents one trace header field; the columns corresponding to the selected Horizontal axis, Vertical axis, and Color header are highlighted to make them easy to identify. This output is only populated when Update table items is enabled.
Output points vector - The cross-plot data produced by the module, stored as a vector of points where each point carries the values of the selected Horizontal axis (X), Vertical axis (Y), and Color (Z) trace headers. Connect this output to other modules that require a point-cloud representation of the trace geometry distribution, such as custom QC or visualization workflows.
![]()
![]()
In this example, we are QCíng the trace headers information after Binning. The example workflow is pretty simple where we read seismic and navigation of Poland 2D data using ""Read SEG-Y traces" and "Load geometry from SPS" module. Later on we assigned geometry followed by binning.
For our input traces, we've referenced/connected Output trace headers of Binning 2D module to Trace headers of QC trace geometry module.
In the parameters section, we've selected FFID & OFFSET as Horizontal & Vertical axes from the drop down menu. For the visualization purpose, we've selected "CHANNEL" as Color.
The Vista items from QC trace geometry generates the QC plot, GVistaTableItem, Histogram respectively as shown in the below image.
![]()
![]()
There are no action items available for this module so the user can ignore it.
![]()
![]()
YouTube video lesson, click here to open [VIDEO IN PROCESS...]
![]()
![]()
Yilmaz. O., 1987, Seismic data processing: Society of Exploration Geophysicist
 * * * If you have any questions, please send an e-mail to: support@geomage.com * * *