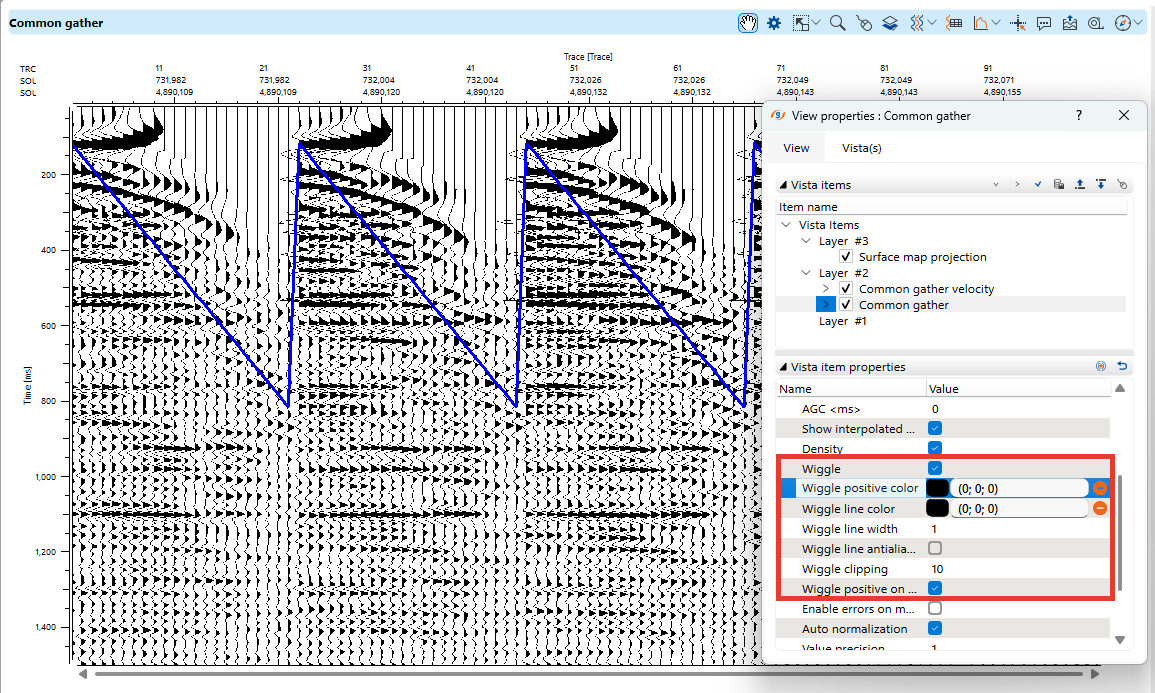
Common Gather View is another essential display for analyzing seismic data, particularly in pre-stack interpretation.
It allows users to examine traces grouped by offset, shot, or receiver locations, aiding in velocity analysis, AVO studies, and noise removal.
Visualization and Display Options
Like Seismic View, Common Gather View provides multiple ways to visualize the data, including adjusting trace alignment and overlaying attributes for analysis. The toolbar contains several icons that help users manage and interact with the dataset efficiently.
Toolbar Functions (Left to Right)
1.Show Properties
Opens a settings window where users can adjust display preferences, such as trace annotations, color modes (wiggle, variable density), and gain adjustments (AGC).
oView Properties: Manages trace headers, graphic headers, and annotations.
oVista Items: Controls display elements like common gathers, selected traces, and selected shot/receiver locations.
oVista Item Properties: Adjusts gain, AGC, color schemes, and applies filters.
oMore visual settings are available in the View Properties panel.
2.Adjust to Size ![]()
Resets the display to its original zoom level.
3.Set/Unset Zoomable ![]()
Enables zoom functionality for focusing on specific trace sections. The tool resets after use and must be reselected for further zooming.
4.Set Control Item ![]()
Allows selection of specific elements within the Common Gather View, such as individual traces or offset groups.
5.Add Vista ![]()
Adds additional visualization elements like shot gathers or receiver gathers.
6.Select Traces ![]()
Enables trace selection with options to clear selections or export selected traces to a file.
7.Trace Headers Table ![]()
Displays header information for selected traces in a separate data window.
8.Spectral Analysis ![]()
Provides amplitude and frequency analysis for common gathers.
9.Set/Unset Mouse Tracker ![]()
Displays horizontal and vertical guide lines for precise tracking.
10.Tool Tip ![]()
Shows relevant data based on cursor position.
11.Export Picture ![]()
Captures and saves seismic gather views in various formats for documentation or presentations.
12.Ruler Tool ![]()
Measures distances, such as event velocity, by drawing a line on the display.
13.Region Map Tool ![]()
Enables users to create and manage regions of interest within the common gather dataset for detailed analysis.
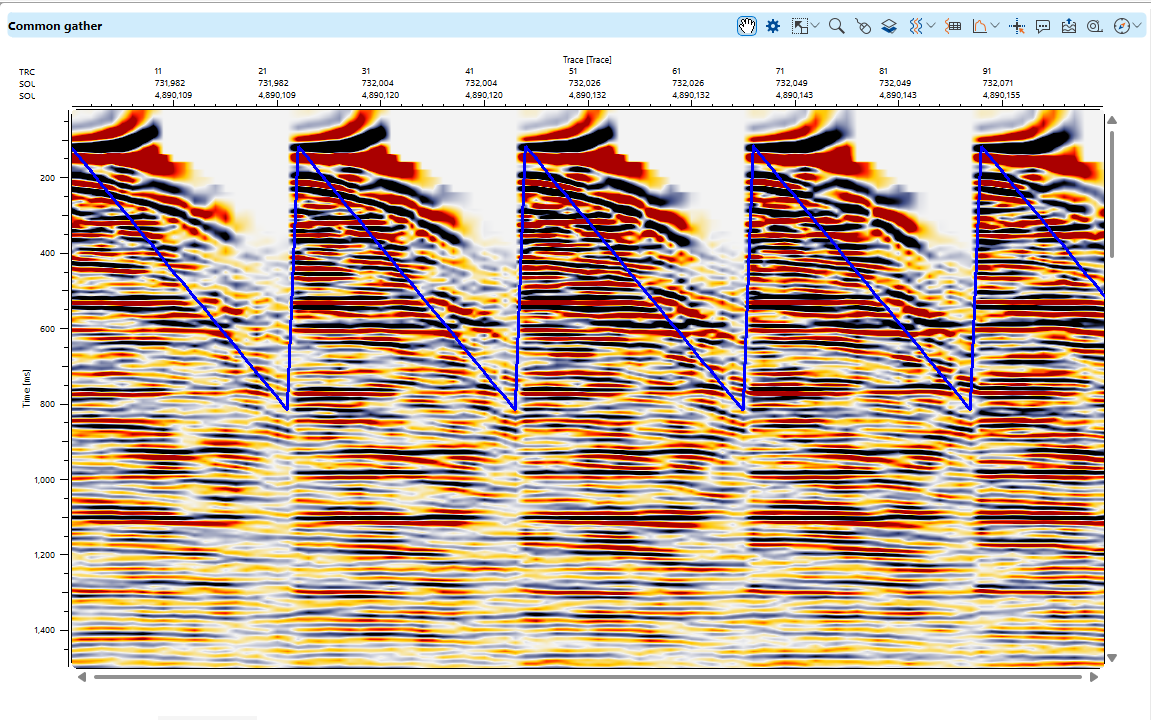
Display Modes
•Wiggle and Variable Density: Users can switch between wiggle traces and color-filled sections.
•Trace Spacing and Overlap: Adjustments allow better visibility and clarity of seismic events.
•Custom Gain Settings: Helps enhance signal clarity in wiggle mode.