Frequency filtering
![]()
![]()
This module works in the frequency domain and has a single bandpass filter mode, for the entire trace length, specified as four corner frequency values F1-F2---F3-F4. In the frequency domain application, the amplitude spectra of the input seismic trace and the filter operator are multiplied. The main goal of using band-pass operator is passing limited amplitudes via the cut-of frequencies. Where F1-F2 is the first damping slope, F2-F3 is maximum band pass and F3-F4 is the second (end) damping slope.
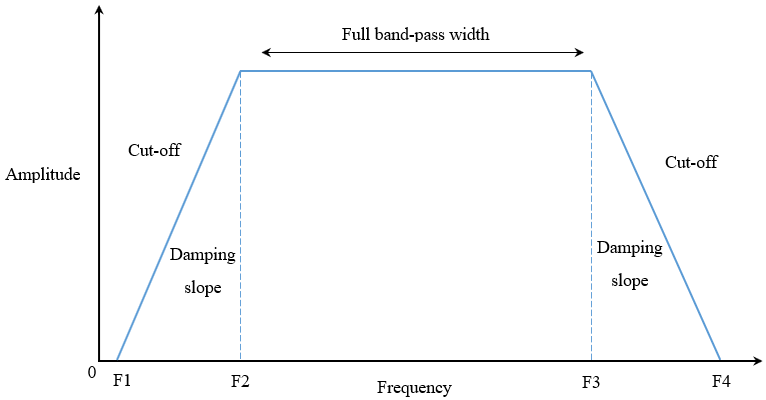
Fig.1 Band-pass spectrum view.
![]()
![]()
No actions
![]()
![]()
Gather - input seismic traces (prestack or poststack), any sorting.
![]()
![]()
Frequency 1 <Hz>
Start frequency, start damping slope.
Frequency 2 <Hz>
Start full band-pass frequency, end damping slope.
Frequency 3 <Hz>
End full band-pass frequency, start damping slope.
Frequency 4 <Hz>
End frequency, end damping slope.
![]()
![]()
Skip - switch-off this module (do not use in the workflow).
Auto-connection - module is connected with previous (and next) modules in the workflow by default.
Bad data values option
There are 3 options for corrupted (NaN) samples in trace:
Fix - fix corrupted samples.
Notify - notify and stop calculations.
Continue - continue calculations without fixing.
Calculate difference - perform conventional subtraction input and output gathers (DIFF = IN - OUT), and result is displayed on the difference visual vista.
Number of threads - perform calculation in the multi-thread mode.
![]()
![]()
Output gather - input seismic data minus ghost model.
![]()
![]()
A test seismic data set is the Poland 2D (land) line, you Poland 2D line that is accessible on the internet free or it is also included to the g-Platform installation (C: \Program Files (x86)\Geomage \gPlatform \demodata\ Poland_2D_Vibroseis_LINE_01).
An example of the workflow for band-pass filtering:
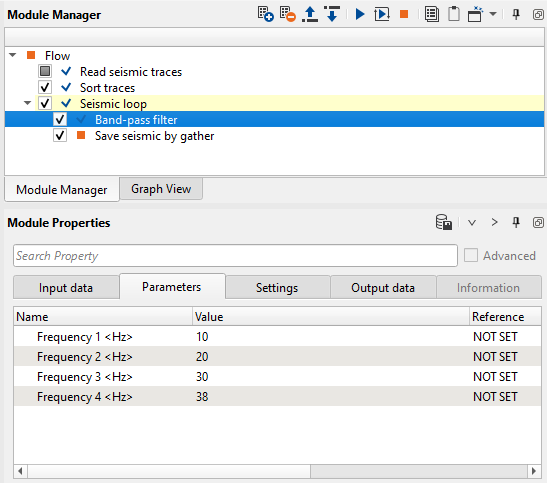
Fig.2 Workflow example.
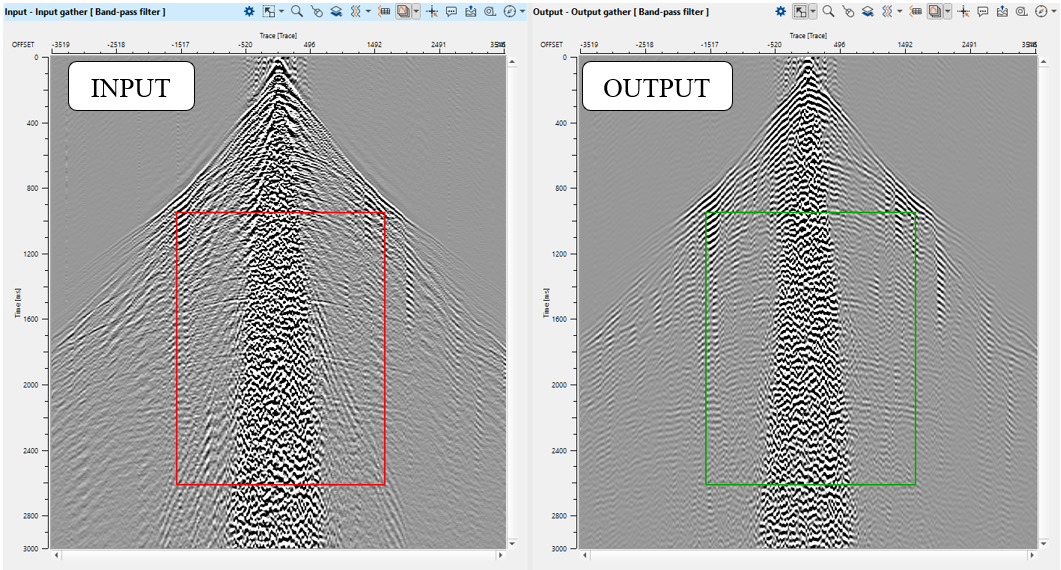
Fig.3 Gathers: input (left) and output (right).
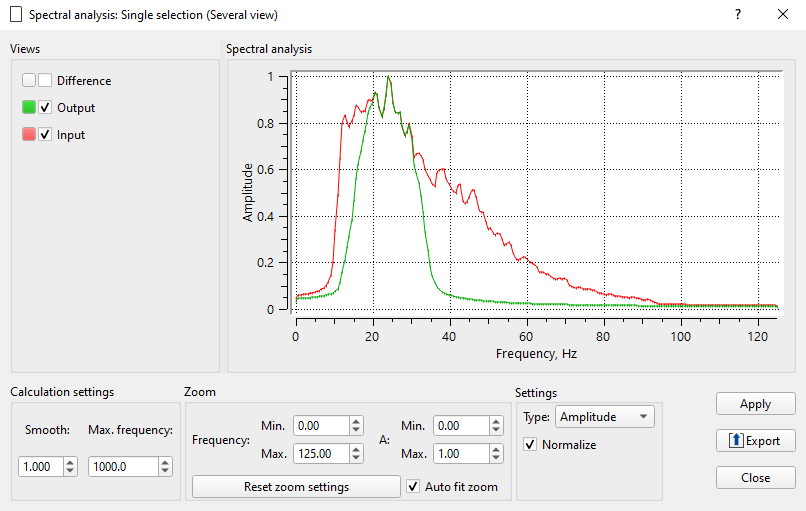
Fig.3 Amplitude frequency spectrum: input (red) and output (red).
![]()
![]()
YouTube video lesson, click here to open [VIDEO IN PROCESS...]
![]()
![]()
Yilmaz. O., 1987, Seismic data processing: Society of Exploration Geophysicists
Oppenheim A. V., and Schafer, R. W., 1975, Digital signal processing
* * * If you have any questions, please send an e-mail to: support@geomage.com * * *