In this section, we are going to discuss "Radon multiple attenuation by velocity". In principle this method is same as Radon multiple attenuation however the application is different. This is based on the velocity muting. The data should be transformed from T-X domain to Tau-P domain. From here onwards it is slightly different where we define the velocity percentage from the central velocity function at different time intervals. Based on the central velocity function and the defined % velocity, it acts as a taper zone and anything below this % velocity will be muted. These velocities are low velocities where multiples present.
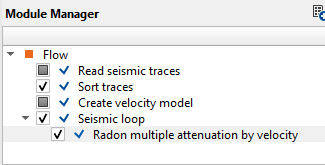
Module name Radon multiple attenuation by velocity
An example work flow should look like this.
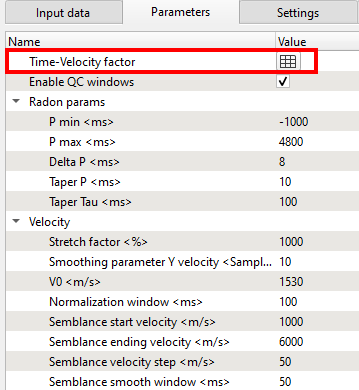
In the Parameters tab, the user should provide Time-Velocity factors in the table. Define the Radon params. In the Optional section, the user can limit the frequency range, wants to apply AGC to the data for display or not etc are available. Once the parameters are set, we can generate the vista items to see the output(s) before and after the Radon multiple attenuation by velocity module.
Please make a note of it that, we are providing a velocity model information to the input data tab so that the data is in NMO. What we get from the vista items is Input and Output without any NMO correction and the corresponding velocity analysis. If the user wants to take a look at the NMO gathers, that can also be available as NMO gathers. Besides the Radon analysis window is also available to assess the Radon parameters and adjust accordingly.
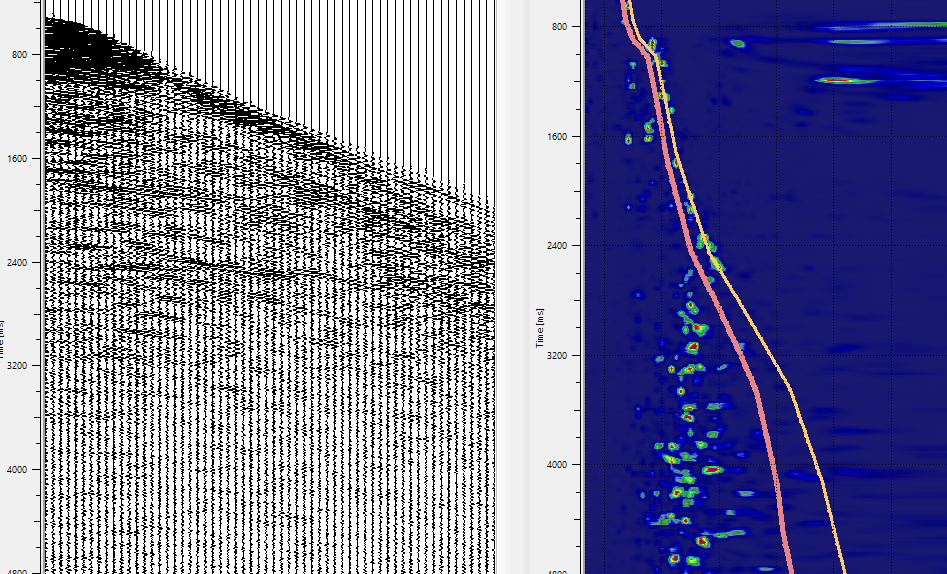
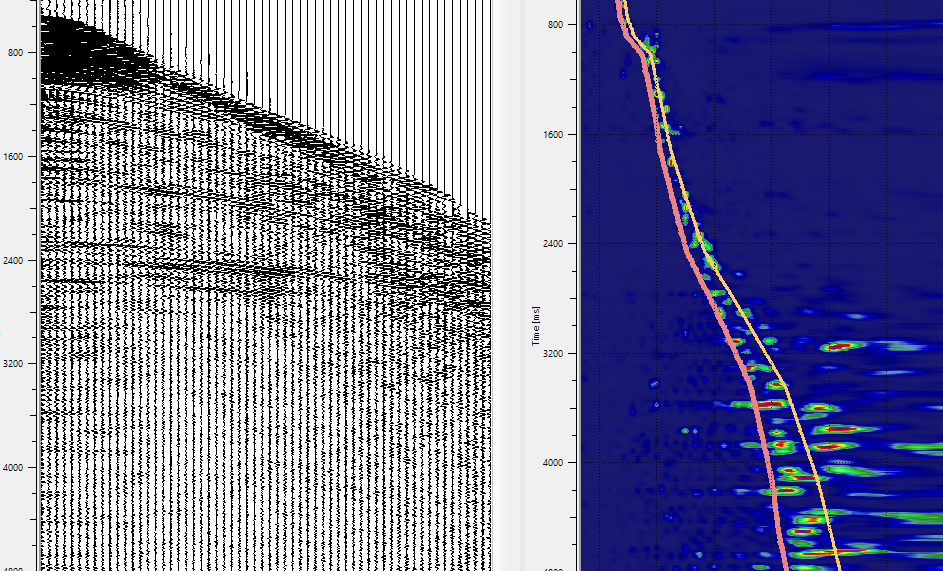
From the above images, on the right hand side we can see the velocity semblance with the velocity trend lines. The yellow line is the input velocity line and the brown line is the user defined time-velocity % trend. Anything below the brown line should be muted which are predominantly multiples.