Calculating seismic attributes
![]()
![]()
Seismic Attributes 3D (Distributed) module is used to generate different seismic attributes from a 3D seismic volume. These attributes help in enhancing geological and structural features that are not easily visible in the original seismic data.
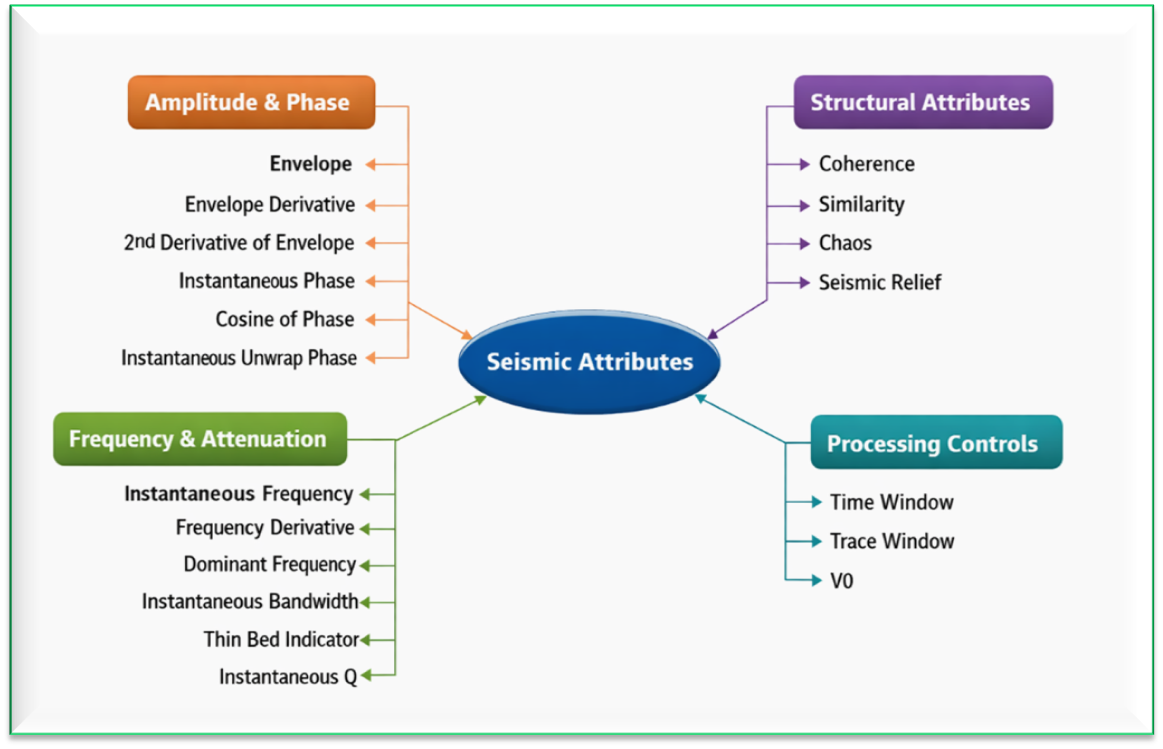
Seismic attributes describe various characteristics of the seismic signal such as:
•amplitude strength
•phase behavior
•frequency variations
•attenuation effects
•structural discontinuities
These attributes are commonly used for interpretation tasks like:
•fault detection
•channel identification
•thin bed detection
•fracture zones
•possible hydrocarbon indicators
The attributes are computed using a user-defined time window and trace window around each seismic sample.
For this module, the input data should be a 3D volume. This module generates one or more 3D attribute volumes with the same size and geometry as the input seismic data.
![]()
![]()
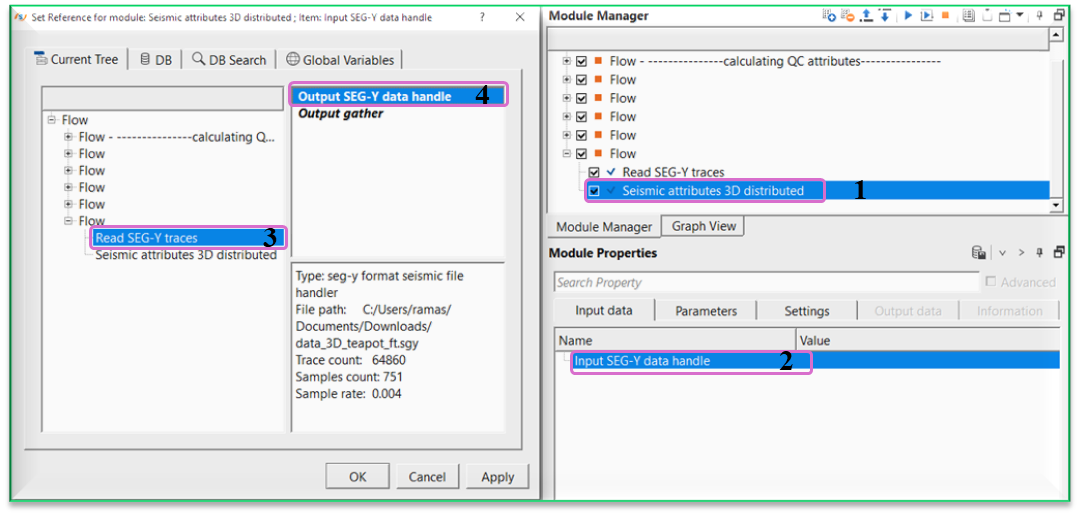
Input SEG-Y data handle - this will be a 3D post stack volume. Connect/reference to Output SEG-Y data handle or Output gather.
![]()
![]()
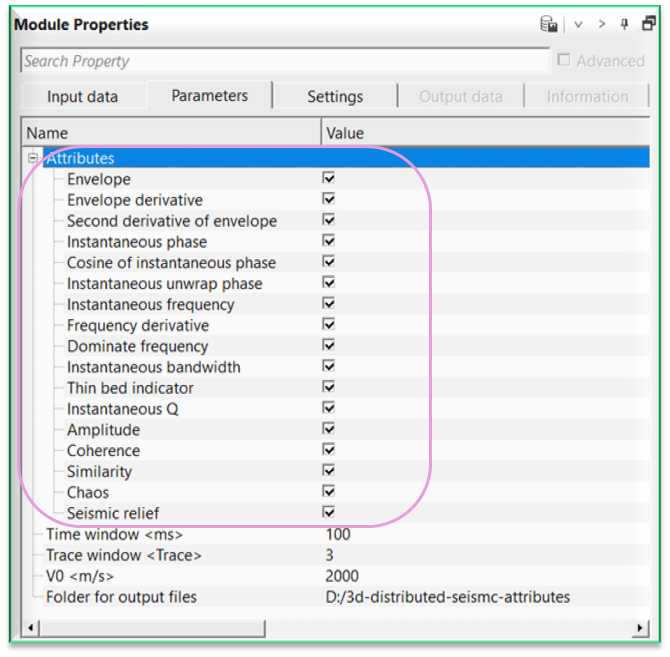
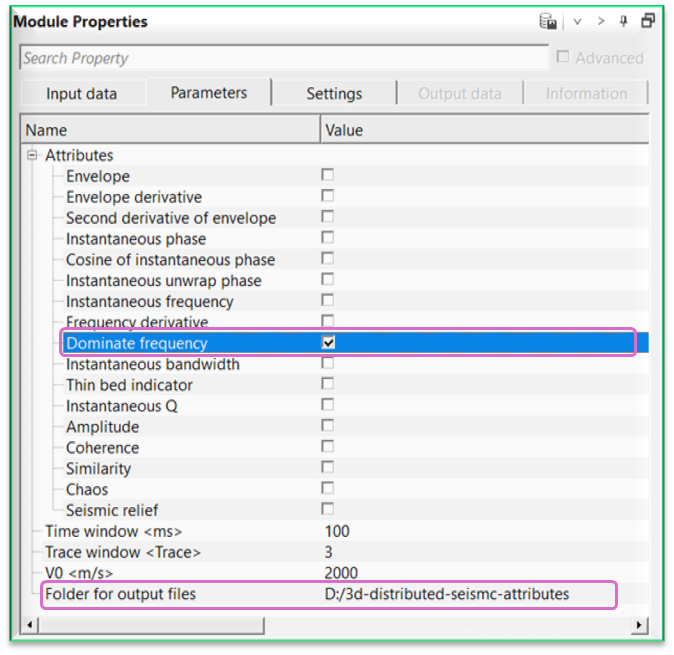
Attributes - there are many attributes that can be calculated by using this module, however, the user has the option to select either one or all of the attributes to calculate at a time. For this, the user should select the required/all attribute from the below list and provide the output file name and path. This resultant attribute will be generated and stored at the user specified path. By default, all attributes are checked (TRUE) and will be calculated.
Envelope - calculates the instantaneous amplitude of the seismic trace. Envelope represents the strength of the seismic reflection independent of polarity.
Commonly uses for
•bright spot identification
•channel detection
•general amplitude anomaly analysis
Envelope derivative - calculates the first derivative of the envelope. This highlights rapid changes in reflection strength.
Commonly uses for
•thin bed detection
•sharp impedance contrasts
•stratigraphic boundaries
Second derivative of envelope - calculates the second derivative of the envelope. This further enhances subtle amplitude variations and thin-bed effects.
Commonly uses for
•thin bed interpretation
•subtle stratigraphic features
Instantaneous phase - calculates the instantaneous phase of the seismic signal. Phase shows reflector geometry independent of amplitude.
Commonly uses for
•horizon tracking
•structural interpretation
•reflector continuity analysis
Cosine of instantaneous phase - calculates the cosine of the instantaneous phase. This represents the normalized in-phase component of the signal.
Commonly uses for
•structural enhancement
•reflector continuity
Instantaneous unwrap phase - calculates the unwrapped instantaneous phase. Phase unwrapping removes discontinuities caused by phase wrapping.
Commonly uses for
•stable frequency computation
•advanced phase analysis
Instantaneous frequency - calculates the local frequency of the seismic signal. This represents how fast the waveform oscillates at each sample.
Commonly uses for
•thin bed detection
•frequency shadow identification
•lithology variation
Frequency derivative - calculates the rate of change of instantaneous frequency. This highlights rapid frequency variations.
Commonly uses for
•thin bed tuning analysis
•subtle stratigraphic features
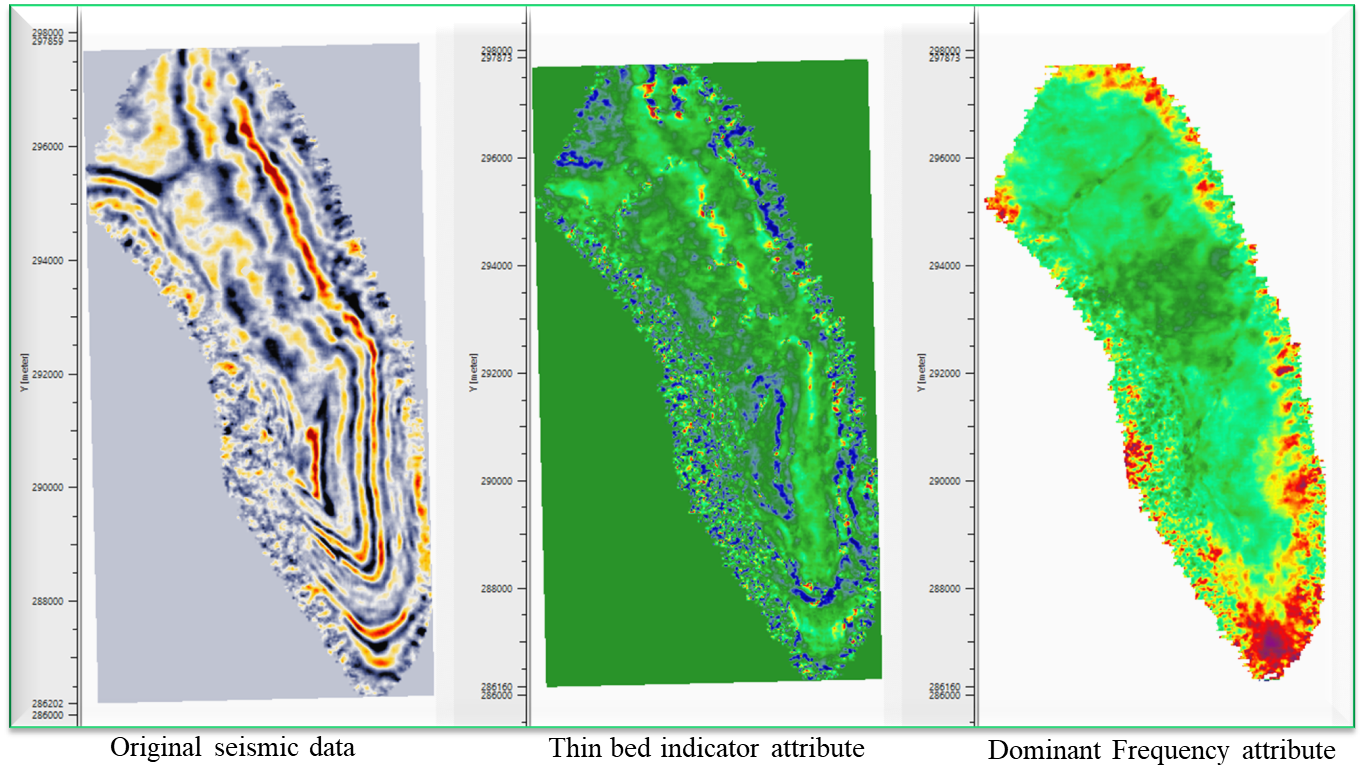
Dominate frequency - calculates the dominant frequency of the seismic signal within the analysis window. This represents the frequency with the strongest spectral energy.
Commonly uses for
•lithology variations
•attenuation studies
Instantaneous bandwidth - calculates the frequency bandwidth of the signal around the instantaneous frequency. This indicates how wide the frequency spectrum is.
Commonly uses for
•attenuation analysis
•thin bed detection
Thin bed indicator - calculates an attribute designed to highlight thin layers below seismic resolution. This attribute uses frequency and amplitude information.
Commonly uses for
•thin reservoir identification
•stratigraphic interpretation
Instantaneous Q - calculates the instantaneous Q factor, which represents seismic attenuation. Low Q values indicate higher attenuation.
Commonly uses for
•gas detection
•fracture zones
•reservoir quality analysis
Amplitude - displays the original seismic amplitude. This represents the reflection strength at each sample.
Commonly uses for
•general seismic interpretation
•amplitude anomaly detection
Coherence - calculates the similarity of neighboring seismic traces. Low coherence values usually indicate structural discontinuities.
Commonly uses for
•fault detection
•fracture identification
Similarity - measures waveform similarity between adjacent traces. This attribute highlights subtle discontinuities.
Commonly uses for
•channel boundaries
•stratigraphic features
Chaos - calculates a measure of seismic waveform disorder. High chaos values indicate disrupted or chaotic reflectors.
Commonly uses for
•gas chimneys
•fracture zones
Seismic relief - generates a relief-style visualization of seismic amplitude. This enhances reflector geometry and structural edges.
Commonly uses for
•structural interpretation
•visualization of seismic features
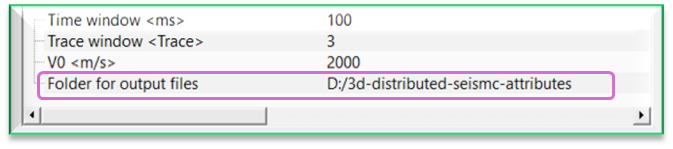
Time window - defines the vertical time interval used in attribute computation. A larger time window uses more samples and produces smoother results.
Typical values depend on the seismic bandwidth.
Trace window - defines the number of neighboring traces used in multi-trace attributes. A larger trace window increases spatial smoothing. Used mainly for attributes such as coherence, similarity & chaos.
V0 - reference velocity parameter used in certain frequency-related calculations. This parameter helps stabilize attribute estimation when velocity information is required.
Folder for output files - specify the calculated attribute output file name and path. The output file will be in internal file format.
![]()
![]()
Distributed execution - if enabled: calculation is on coalition server (distribution mode/parallel calculations).
Bulk size - chunk size is RAM in megabytes that is required for each machine on the server (find this information in the Information, also need to click on action menu button for getting this statistics).
Limit number of threads on nodes - limit numbers of of threads on nodes for performing calculations.
Job suffix - add a job suffix.
Set custom affinity - an axillary option to set user defined affinity if necessary.
Set custom affinity - true
Affinity - add your affinity to recognize you workflow in the server QC interface.
Number of threads - One less than total no of nodes/threads to execute a job in multi-thread mode. Limit number of threads on main machine.
Run scripts - it is possible to use user's scripts for execution any additional commands before and after workflow execution.
Script before run - path to ssh file and its name that will be executed before workflow calculation. For example, it can be a script that switch on and switch off remote server nodes (on Cloud).
Script after run - path to ssh file and its name that will be executed before workflow calculation.
Skip - By default, FALSE(Unchecked). This option helps to bypass the module from the workflow.
![]()
![]()
There are no output vista items available for this module.
There is no information available for this module.
![]()
![]()
In this example workflow, we are reading a 3D stack volume by using Read SEG-Y traces module.
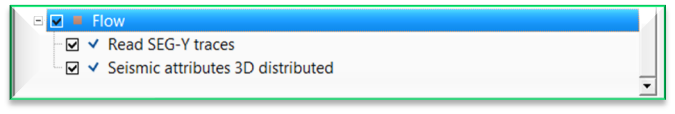
Make the necessary connections/references to Seismic attributes 3D distributed module.
Choose the desired attributes from the Attributes section and the corresponding trace and time windows.
![]()
![]()
There are no action items available for this module.
![]()
![]()
YouTube video lesson, click here to open [VIDEO IN PROCESS...]
![]()
![]()
Yilmaz. O., 1987, Seismic data processing: Society of Exploration Geophysicist
 * * * If you have any questions, please send an e-mail to: support@geomage.com * * *
![]()