Float array
Generates floating arrays useful for parameter testing.
Theory
This module is very useful when the user do parameter testing. User can set up a particular parameter with different values like (prediction interval and predictive distance for deconvolution testing). User can put the start and end values of Predictive length as 4 to 16 ms with a step size of 4ms. This will generate 4 sets of output data.
 This module MUST be used in combination with Loop, Generate string, Generate File name.
Input data
There are no input data parameters for this module.
Parameters
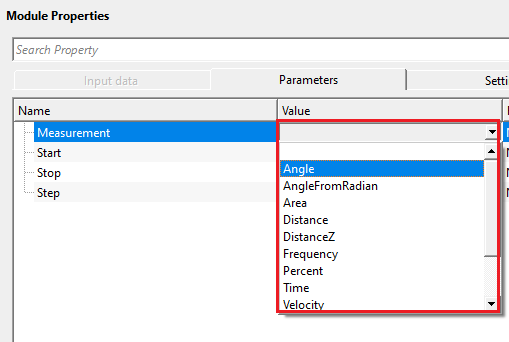
Measurement { , Angle, AngleFromRadian, Area, Distance, DistanceZ, Frequency, Percent, Time, Velocity, Volume, e-0, e-2, e-8 }
select the measurement from the drop down menu.
Specifies the physical unit type for the generated values. Choosing the correct unit ensures that when the output collection values are referenced by downstream modules (such as a band-pass filter frequency parameter or a deconvolution prediction interval), the software interprets the numbers in the right domain. For example, select Frequency when sweeping filter corner frequencies (in Hz), Time when sweeping prediction intervals or window lengths (in seconds/milliseconds), Velocity when sweeping migration velocities (in m/s), and Distance or DistanceZ when sweeping lateral or vertical spatial apertures (in meters). Changing the Measurement automatically updates the units displayed next to the Start, Stop, and Step fields. Leave the field blank (empty selection) if the values are dimensionless.
Start
specify the starting value
The first value that will appear in the output collection. For example, if you are testing filter frequencies starting at 5 Hz, set Start to 5. The units are controlled by the Measurement selection above. This is the value used in the first iteration of the Loop when iterating over the collection.
Stop
specify the stop/end value
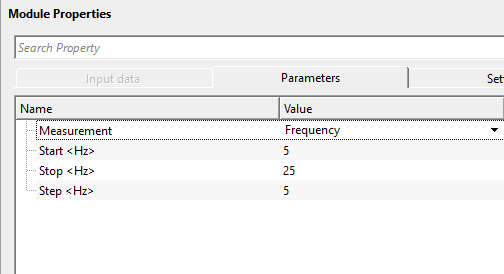
The upper bound of the sequence. The module generates values up to and including this value (subject to the Step size). For example, setting Start = 5, Stop = 25, and Step = 5 produces the sequence: 5, 10, 15, 20, 25 — five output values in total. The Stop value does not need to be exactly divisible by the Step; values are generated as long as they do not exceed the Stop limit.
Step
specify the step size
The increment between successive values in the collection. Step must not be zero — a value of zero will cause an error when the module executes. Set a positive Step to generate an ascending sequence (Start < Stop), or a negative Step to generate a descending sequence (Start > Stop). For example, Start = 16, Stop = 4, Step = -4 produces: 16, 12, 8, 4. The number of values in the output collection equals floor((Stop - Start) / Step) + 1. Fractional step sizes are supported for fine-grained parameter sweeps.
Settings
Skip
By default, FALSE(Unchecked). This option helps to bypass the module from the workflow.
Output data
Collection
this displays the collection of floating values which were mentioned in the parameters tab.
The output of the Float array module is a collection of floating-point values computed from the Start, Stop, and Step parameters. This collection must be connected to the Loop module, which will iterate through each value in the collection one by one. After executing the module, you can inspect the individual values listed below under the Collection heading (Float 1, Float 2, ..., Float n) to verify that the generated sequence matches your testing plan. The collection carries the unit type specified in the Measurement parameter, ensuring that downstream modules correctly interpret the values in the right physical domain.
Float
displays the 1st floating value
Float
displays the 2nd floating value
Float
displays the 3rd floating value
Float
displays the n-1th floating value
Float
displays the nth floating value
Information
This module has no custom action buttons. The collection is generated automatically when the module executes as part of a Loop workflow. No manual actions are required.
Examples
In this example workflow, we are testing band pass filter parameters (high cut) with different values starting from 5Hz to 25Hz with an increment of 5 Hz.
For this exercise, we are reading a stack section by using "Read seismic traces" with Load data to RAM as YES option.
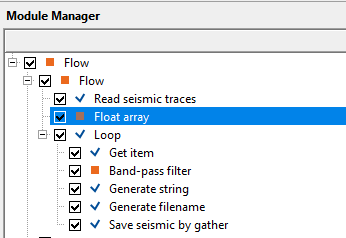
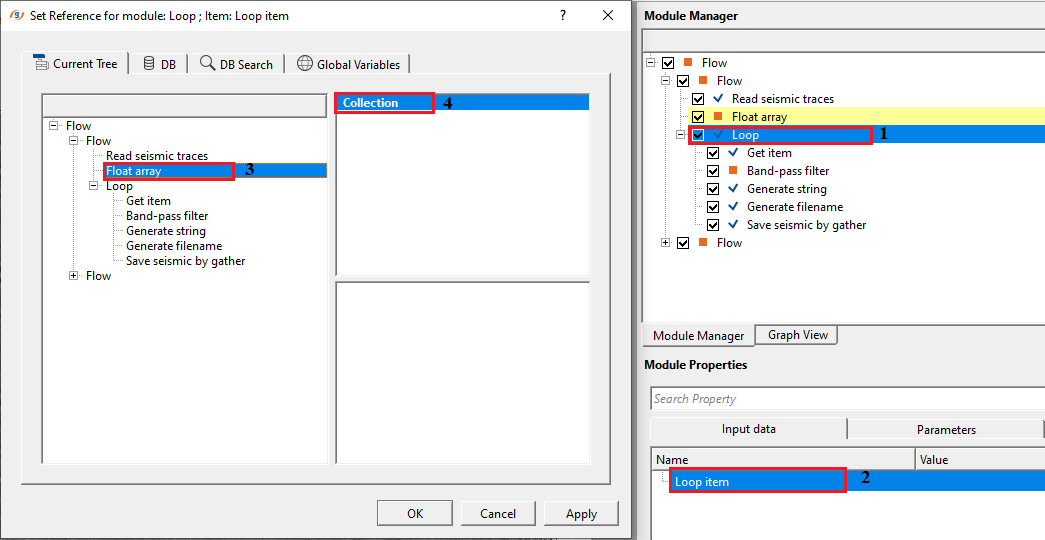
Now we need to connect/reference the collections from the Float array module to the Loop module
Inside the Loop, we add Get item, This will fetch the sequence numbers from the Loop module.
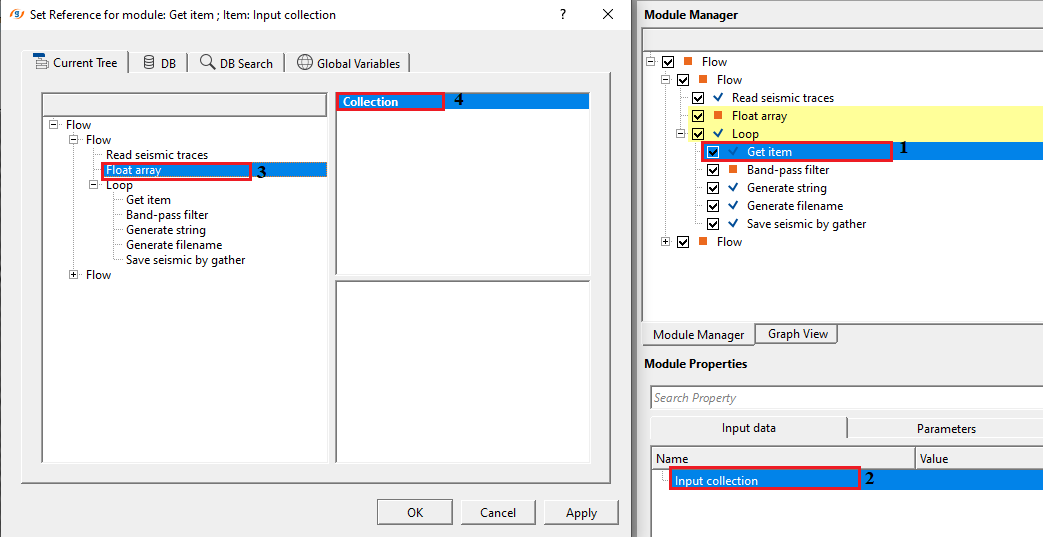
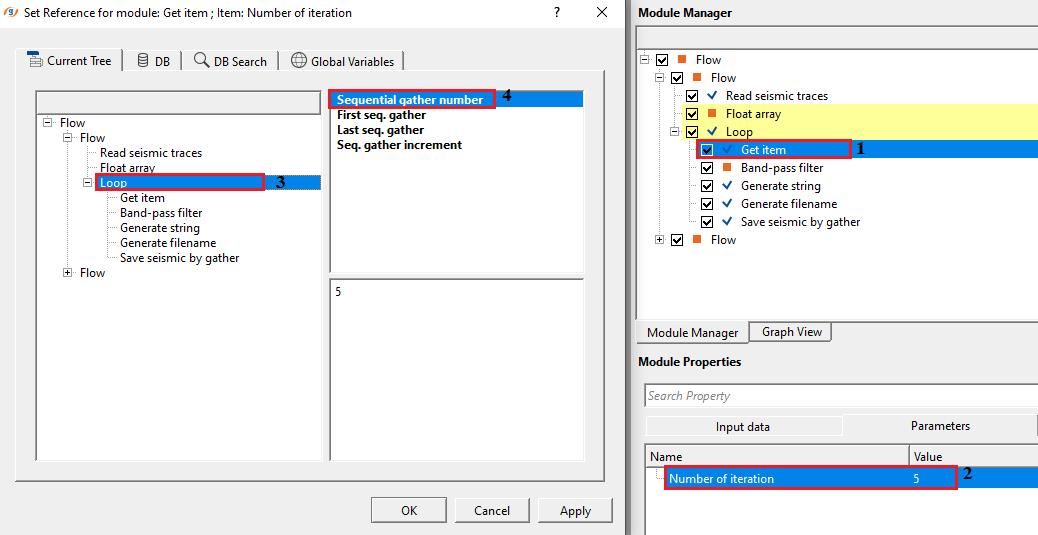
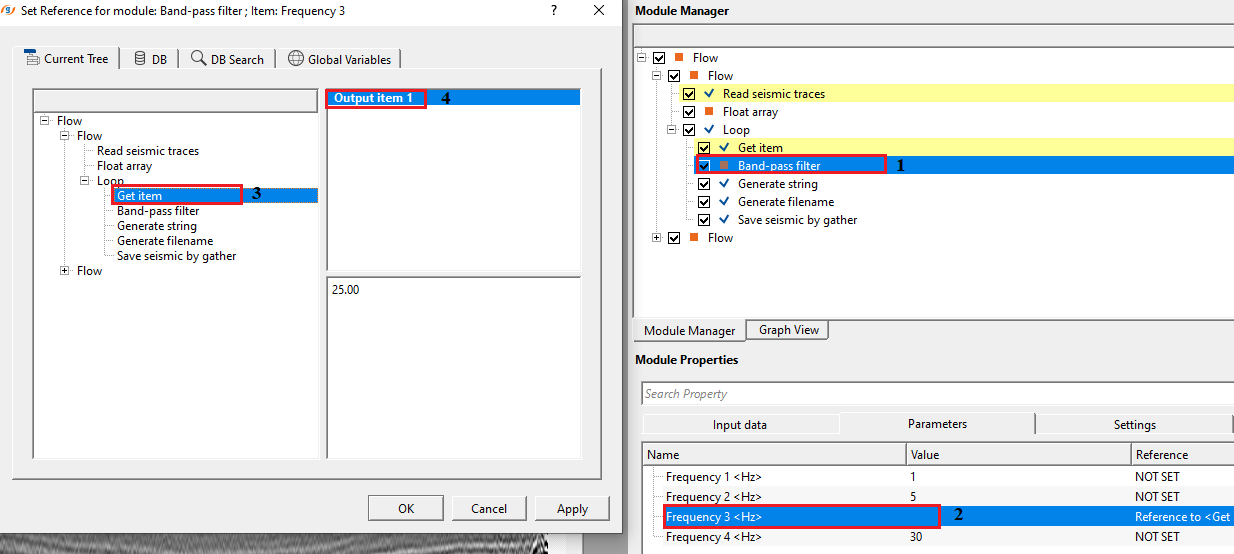
Next, we make the connection/reference to Output gather from Read seismic traces module to Input gather of Band pass filter module.
We make the connection/reference to Frequency 3 to Output item 1 of Get item.
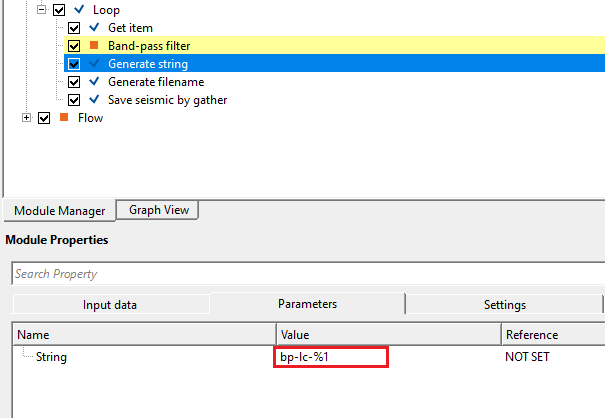
Since we are testing multiple parameter values, we'll generate strings for each parameter as a separate file name. For that, we first generate the string and later create the file name by using "Generate filename" module.
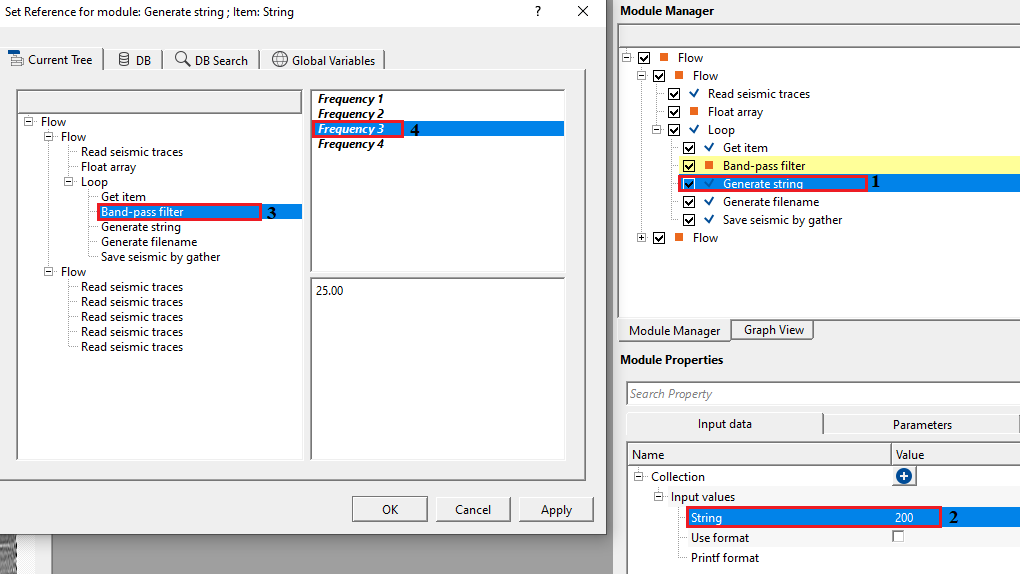
The user has to specify the string name in the Parameters tab.
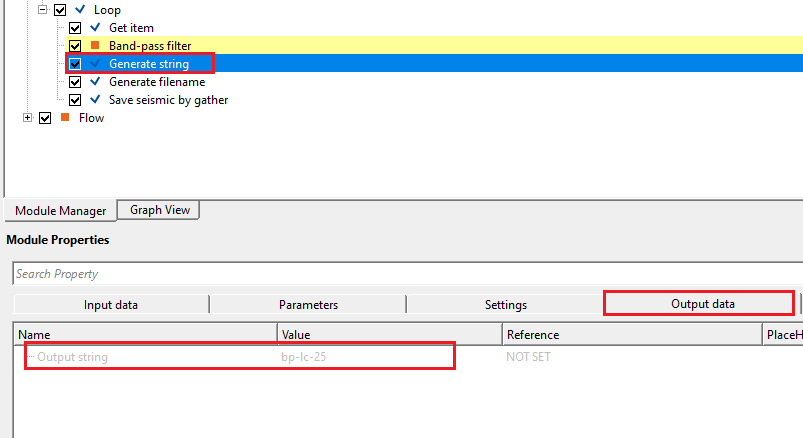
This will generate a string and the user can check this under Output tab.
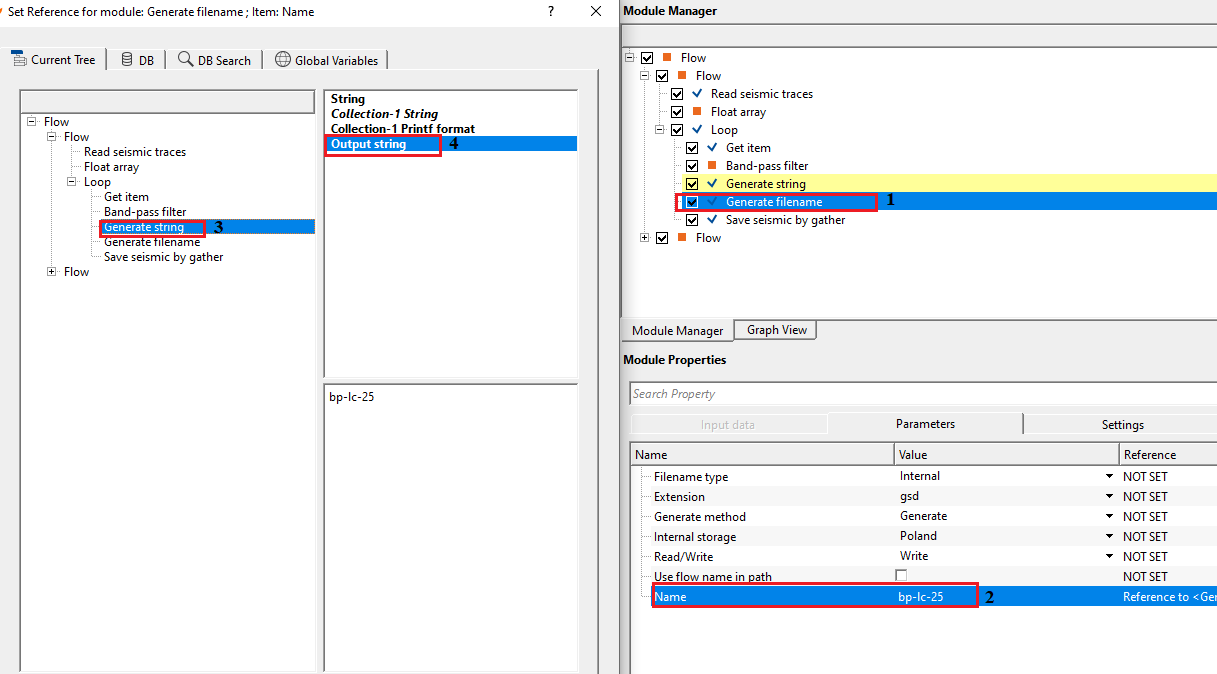
Later, this output string is referenced/connected to Filename of the Generate Filename module.
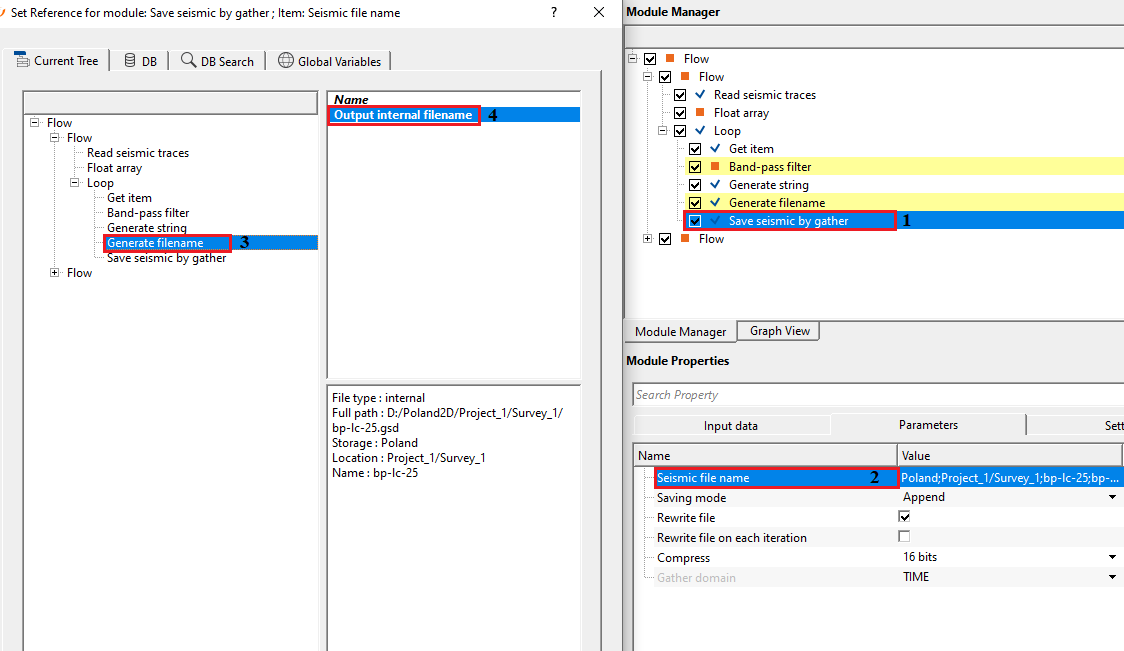
At the end, the user has to connect/reference the Output gather from Band-pass filter module to Input gather of Save seismic by gather module. And lastly, filename is connected/referenced to Output file name of Save seismic by gather module.
After completing all the connections/references, select Loop module and click on Execute all modules button. This will run in a loop and output 5 datasets.
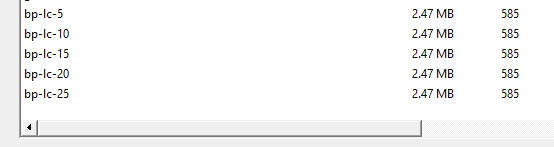
To QC all these 5 datasets, read all of them using Read seismic traces and display each of the Output gather. Compare the results and choose the best parameter.
Actions
There are no action items available for this module.
Video lesson
YouTube video lesson, click here to open [VIDEO IN PROCESS...]
Related articles
Yilmaz. O., 1987, Seismic data processing: Society of Exploration Geophysicist
 * * * If you have any questions, please send an e-mail to: support@geomage.com * * *