Creating table from Trace headers
![]()
![]()
Create Table module extracts trace header values from seismic traces and organizes them into structured tables. These tables provide a clear view of acquisition geometry and trace-level metadata for quality control, analysis.
Tables reflect the current values stored in trace headers. Any geometry or header edits should be followed by table regeneration. Large surveys may produce large full trace-header tables
Tables can be generated at source, receiver, bin (CMP), or trace level, for a single line or the entire survey.
Supported Table Types
Source Table – one row per unique source point
Receiver Table – one row per unique receiver location
Bin (CMP) Table – one row per unique midpoint or bin
Traces Table – one row per trace, for all traces
Output
The module outputs one or more tables that can be:
Viewed and filtered interactively
Used as input to other processing modules like Export Table.
Exported to external formats (e.g., ASCII)
![]()
![]()
Item (table data) - connect/reference to output trace headers where table data information is available. When the user connects/reference to Output trace headers of "Read seismic traces" and/or "Read SEG-Y traces" or any module where trace headers information contains tabular information that can be used.
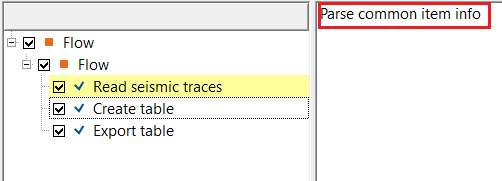
This is the primary input connection for the module. Connect it to the Output trace headers item of a Read seismic traces or Read SEG-Y traces module — or to any other module that exposes trace header information as a convertible table source. Connecting to the Output trace headers item gives access to all four table types (Sources, Receivers, Bins, Traces). Connecting to a source-, receiver-, or bin-specific output will limit the available table types to just that gather type. After connecting this item, run the Parse common item info action to populate the Enum tables drop-down.
![]()
![]()
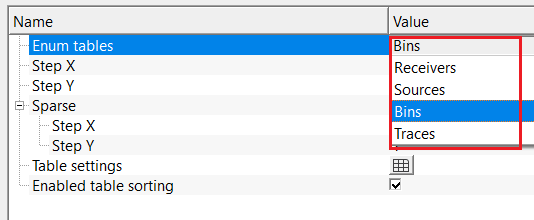
Enum tables { Receivers, Sources, Bins, Traces } - this option allows the user to select the table(s) from the drop down menu. Sometimes, nothing is visible inside the drop down menu. In that case, click on "Parse common item info" in the action item menu and it display the tables.
Step X - specify X step size. By default, 1.
Controls the column-direction (X) sampling stride when building a sparse table from the input data. A value of 1 includes every column entry. Increase this value to sub-sample the data and reduce the number of rows in the output table — useful for quick quality-control checks on very large surveys where every location is not needed. The default value of 1 includes all entries.
Step Y - specify Y step size. By default, 1.
Controls the row-direction (Y) sampling stride when building a sparse table. Works in the same manner as Step X but applies to the row axis. Set both Step X and Step Y to values greater than 1 to create a uniformly decimated preview table. The default value of 1 includes all entries.
Sparse - a parameter group that controls sparse (decimated) table generation. When Step X and Step Y are both set to 1, the full table is produced. Setting either step to a value greater than 1 causes the module to output only every N-th row or column of header data, creating a faster, reduced-size preview table. This is especially useful when working with large 3D surveys.
Step X - column-direction sampling stride for sparse table output. Default is 1 (include all entries). Set to a larger integer to include only every N-th column entry, reducing the table size.
Step Y - row-direction sampling stride for sparse table output. Default is 1 (include all entries). Set to a larger integer to include only every N-th row entry, reducing the table size.
Table settings - this option allows the user to adjust the table settings like which trace headers should be considered for output, value precision, deleting unnecessary trace headers etc.
The Table settings panel lists all trace header columns that will be included in the selected table type. Each row in the panel corresponds to one header column and has three editable properties:
Header — the name of the trace header field as it will appear as a column label in the output table. This label is read-only and reflects the internal header field name.
Precision — the number of decimal places to display for this column's values in the output table. The default is 1. Increase this value (for example to 3, 4, or 5) for header fields that store high-precision floating-point quantities such as coordinates or elevation values.
Visible — a checkbox that controls whether this column appears in the output table. When checked (default, true), the column is included. Uncheck it to exclude a header field from the output without deleting it from the configuration. This is useful for decluttering the output table by hiding columns that are not relevant to the current analysis.
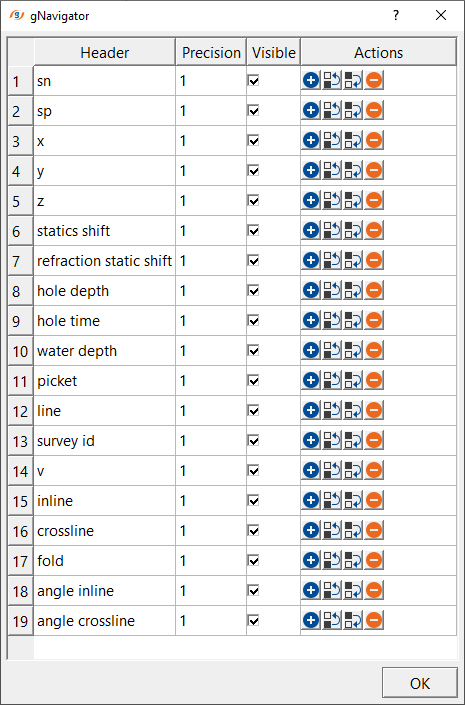
As we mentioned, here the user can change the precision value from 1 to 3/4/5 etc and also, delete the unnecessary trace headers by simply clicking the -ve symbol.
Enabled table sorting - this option allows the user to sort the contents of the tables. By default, FALSE(Unchecked).
When enabled, the output table viewer allows interactive column-based sorting — clicking a column header will sort all rows by that column's values in ascending or descending order. This is convenient for quickly identifying minimum or maximum values, locating gaps in source or receiver numbering, or grouping entries by a specific attribute. By default this option is disabled (unchecked), meaning rows appear in the order they were read from the input data.
![]()
![]()
Number of threads - One less than total no of nodes/threads to execute a job in multi-thread mode. Limit number of threads on main machine.
Skip - By default, FALSE(Unchecked). This option helps to bypass the module from the workflow.
![]()
![]()
Table out - outputs the currently selected table type as a single structured table item. The table contains one row per unique entity (source point, receiver location, bin, or trace) and one column per visible trace header field. This single-table output is the primary item to connect to downstream modules such as Export Table or for interactive viewing. The columns displayed and their precision are controlled by the Table settings parameter.
Tables - a collection of individual table items, one for each table type available in the connected input data (for example, Receivers, Sources, Bins, and Traces). After execution, all available table types are populated in this collection simultaneously, even if only one was selected in the Enum tables parameter during execution. Each table in the collection can be accessed individually by downstream modules or viewed separately in the interactive table viewer.
Receivers - outputs receiver trace header information as a receiver table.
Sources - outputs source trace header information as a source table.
Bins - outputs cmp trace header information as a cmp table.
Traces - outputs all the traces header(s) information as a trace table.
![]() Pay attention this while creating a Traces table when dealing with large size 3D volumes.
Pay attention this while creating a Traces table when dealing with large size 3D volumes.
There is no information available for this module.
![]()
![]()
In this example workflow, we are reading a geometry assigned shot gathers (3D survey). We would like to extract trace headers information for source, receiver and bin gathers in the form of Tables.
Here we are using the Output trace headers of Read seismic traces module as an Item (Input table) for the Create table module.
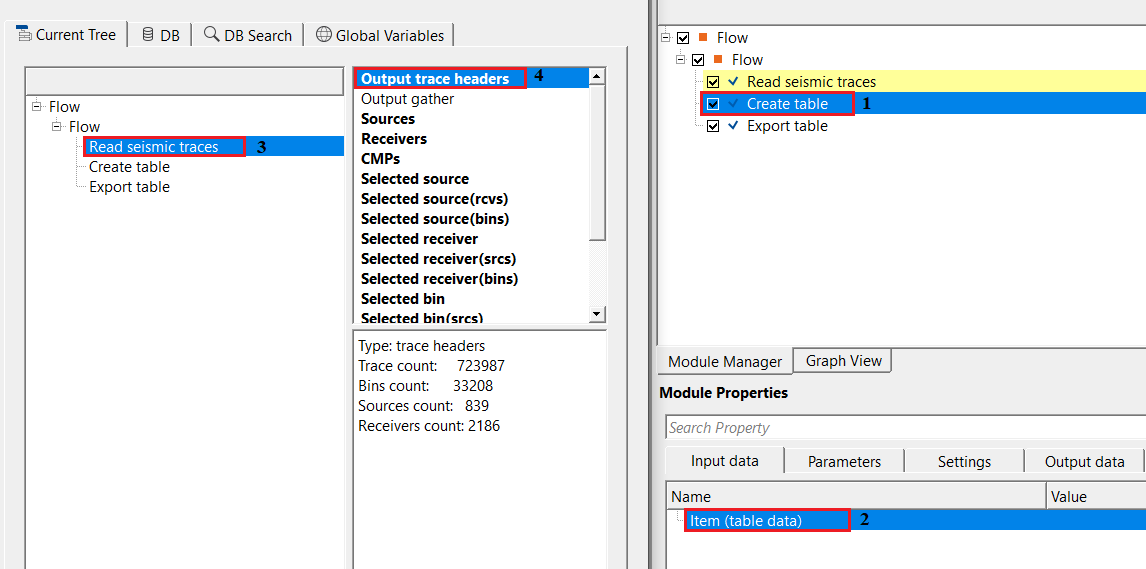
Output trace headers gives flexibility to get all of the gather(s) information like source, receiver, bin and traces whereas if the user chooses any other options from it it will possible only to that particular gather like source or receiver or bin/CMPs.
For each table i.e., source/receiver/bin/trace, the user should select the desired/required table from the drop down menu and execute the module. In case, the user wants to adjust/modify the output table information, click on "Table settings" option and try add/delete any particular trace header or adjust the precision value.
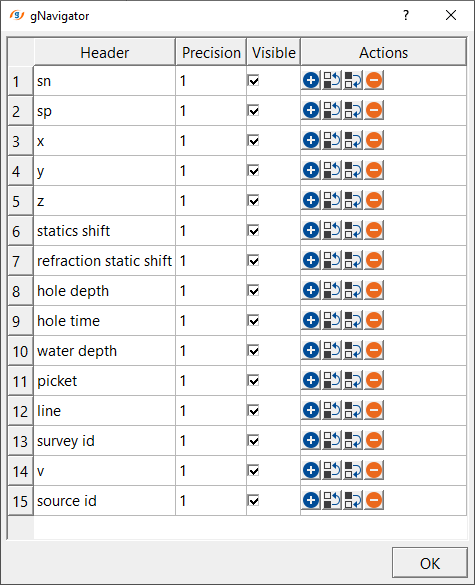
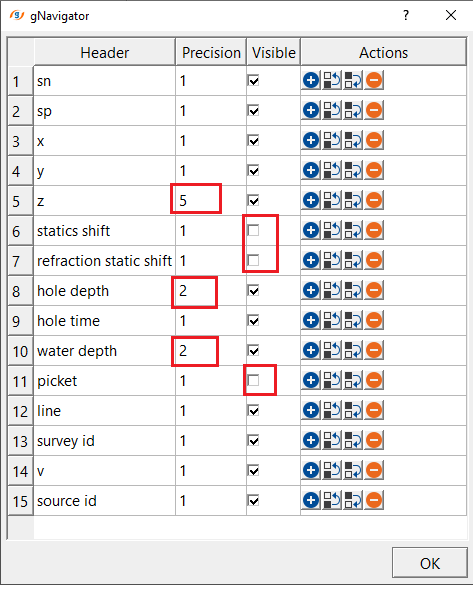
On the left hand side, it is the actual source information that is going to be created as a source table, however, if the user wants to increase the precision values of Z, Hole depth & Hole time, simply change the existing value to new value. Similarly, if the user doesn't want some of the trace headers in the final source table simply uncheck those trace headers in the Visible column. These column will not be output in the final source-table.
![]()
![]()
Parse common item info - this action reads the connected input item and extracts all available table types and their column definitions. Run this action after connecting the input data item and before executing the module. It populates the Enum tables drop-down with the available table types (Receivers, Sources, Bins, Traces) and fills the Table settings list with the corresponding column names. If the Enum tables drop-down appears empty, use this action to refresh it. This action must be run at least once before the module can be executed successfully.
![]()
![]()
YouTube video lesson, click here to open [VIDEO IN PROCESS...]
![]()
![]()
Yilmaz. O., 1987, Seismic data processing: Society of Exploration Geophysicist
 * * * If you have any questions, please send an e-mail to: support@geomage.com * * *