LNA
Linear noise attenuation
Theory
This procedure computes linear wave (noise) attenuation in the frequency-wavenumber (FK) domain in the local sliding time-spatial windows. Input seismic gathers transformed from the time spatial (T-X) domain to the F-K domain. Horizontal waves have infinite apparent velocity and shown as vertical lines in the FK domain. Vertical waves have zero apparent velocity and shown as horizontal lines in the FK domain. This definition uses for attenuate linear waves. This filter module works in F-K domain, which represents two dimensional Fourier transform (FT) over time and space, where F is frequency (FT time) and K is wave number (FT space).
F(\omega,d)=\int\limits_{-\infty}^{+\infty} \int\limits_{-\infty}^{+\infty} f(t,x)e^{-2\pi i (\omega t+dx)}dtdx
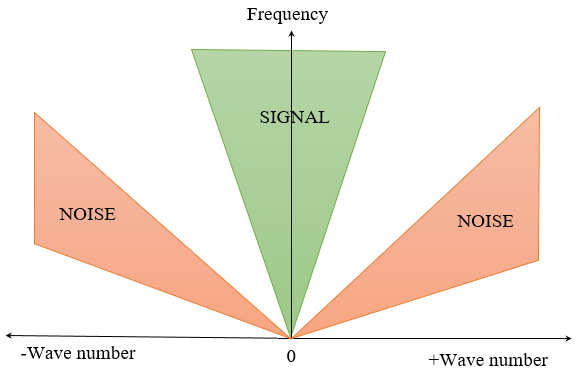
Zones for rejection (reject option is switch on) or saving (reject option is switch off) in the FK domain limited by velocity lines and their slopes must be defined. The slope is apparent velocity in the spatial time (T, X) domain. There is a filter of two velocities (min, max), taper’s bound defined by two mutually exclusive parameters; they are frequency and slopes.
Input data
Input DataItem
Input gather
input seismic gather, NMO-corrected (not strict, but reasonable), any sorting (usually source gather). Connect/reference to the Output gather. If it is inside the Seismic loop, it will automatically connects/reference to the previous modules Output gather.
Parameters
Trace window (traces) [-1 - all traces]
Trace window (traces) [-1 - all traces] <Traces>
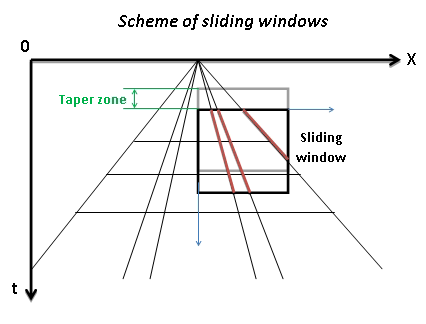
Number of traces for sliding window. This window used for local attenuation. Taper zone between sliding windows is ¼ of trace window.
Time window - Milliseconds for sliding window. This window used for local attenuation. Taper zone between sliding windows is ¼ of time window:
Min frequency
specify the minimum frequency for linear noise attenuation
Max frequency
specify the maximum frequency for linear noise attenuation
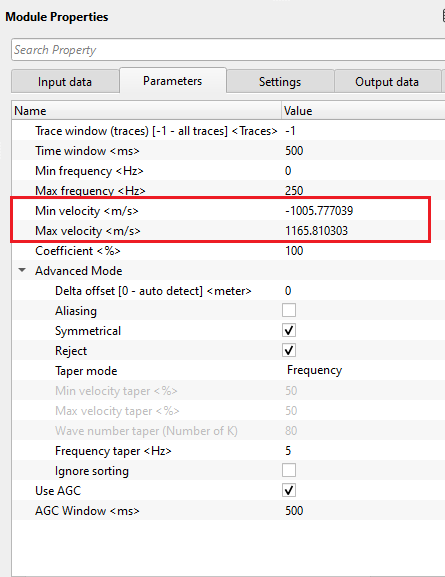
Min velocity
specify the minimum velocity for linear noise attenuation
Max velocity
specify the maximum velocity for linear noise attenuation
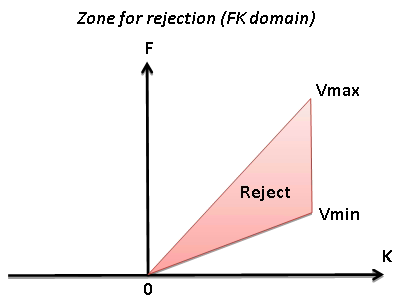
Coefficient - Coefficient (%) for more intensive attenuation with high values, and less intensive attenuation with low values.
Advanced Mode
Delta offset [0 - auto detect]
Distance between traces (meters) in the input gather, need to calculate FK spectrum. By default it is -1, it means read offsets from traces headers and calculate delta offset automatically.
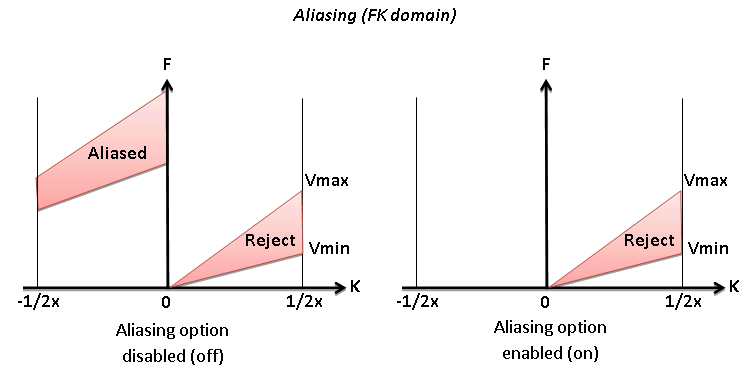
Aliasing
Option for exclude aliasing effect
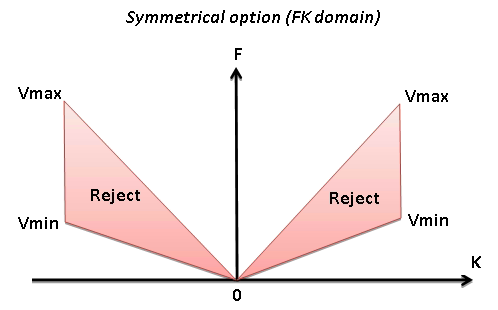
Symmetrical
Option for symmetrical attenuation (positive and negative velocity together):
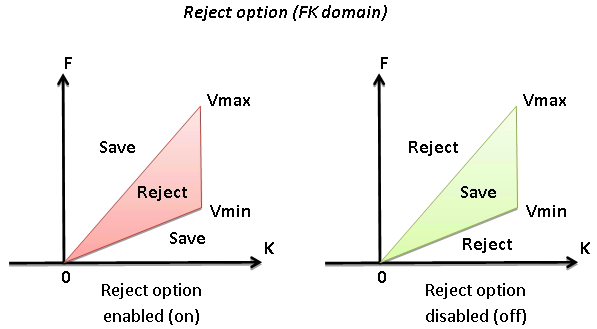
Reject
Option for reject (on) or save (off) data between Vmin and Vmax:
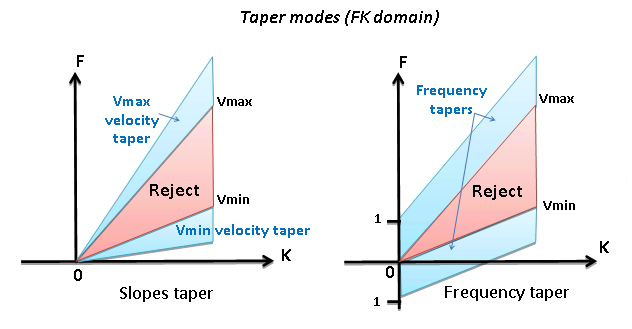
Taper mode { Slopes, Wavenumber, Frequency }
select type of taper zone between reject and save zones from the drop down menu.
Taper mode - Slopes
Taper defined by slope.
Min velocity taper
percentage taper of minimum velocity. The lower the taper percentage the higher the aliasing. Minimum 25% is good starting point.
Max velocity taper
percentage taper of maximum velocity.
Taper mode - Wavenumber
Taper defined by wave number
Wave number taper (Number of K)
number of wavenumber works as a taper.
Taper mode - Frequency
Taper defined by frequency
Frequency taper
specify the frequency taper value
Ignore sorting
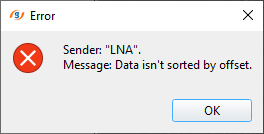
by default, FALSE (Unchecked). If TRUE (Checked), it will not check for the sorting order. Otherwise, it will thrown an error message that the input data is not sorted in OFFSET order.
Use AGC
this deals with the Automatic Gain Correction. By default, FALSE (Unchecked). If the user wants to apply AGC to the input data, turn this option to TRUE (Checked).
AGC Window
specify the AGC window in milliseconds.
Settings
Auto-connection
By default, TRUE(Checked).It will automatically connects to the next module. To avoid auto-connect, the user should uncheck this option.
Bad data values option { Fix, Notify, Continue }
This is applicable whenever there is a bad value or NaN (Not a Number) in the data. By default, Notify. While testing, it is good to opt as Notify option. Once we understand the root cause of it, the user can either choose the option Fix or Continue. In this way, the job won't stop/fail during the production.
Notify
It will notify the issue if there are any bad values or NaN. This will halt the workflow execution.
Fix
It will fix the bad values and continue executing the workflow.
Continue - This option will continue the execution of the workflow however if there are any bad values or NaN, it won't fix it.
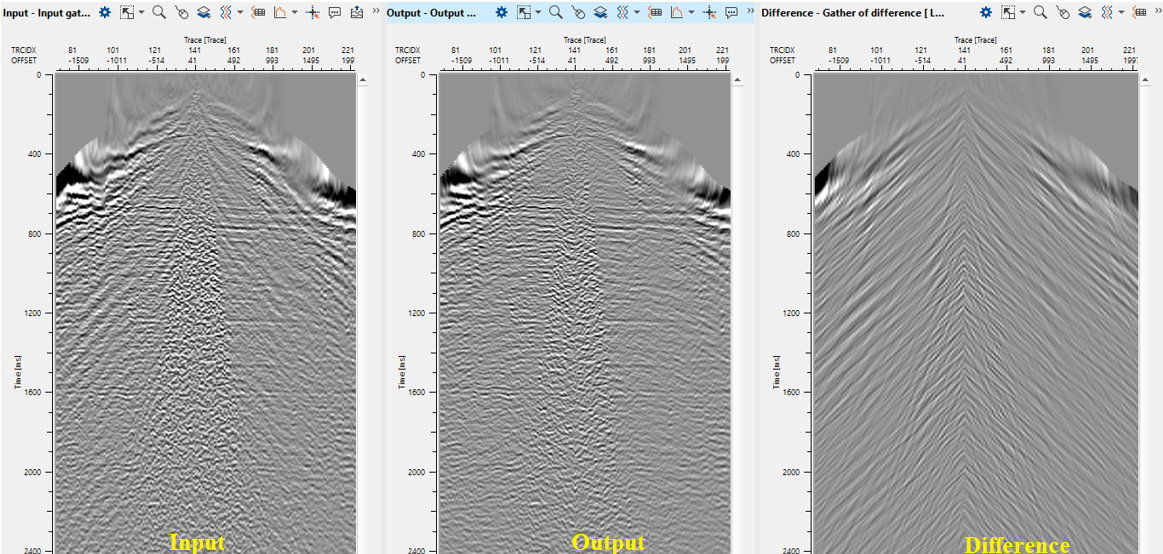
Calculate difference
This option creates the difference display gather between input and output gathers. By default Unchecked. To create a difference, check the option.
Number of threads
One less than total no of nodes/threads to execute a job in multi-thread mode. Limit number of threads on main machine.
Skip
By default, FALSE(Unchecked). This option helps to bypass the module from the workflow.
Output data
Output DataItem
Output gather
generates the linear noise attenuated output gather.
Gather of difference
generates the difference gather between and input and output gather after linear noise attenuation.
Information
Delta offset auto detect
this provides the delta offset value. By default, 0.
Examples
In this example workflow, we are using a LNA inside the Seismic loop along with NMO module.
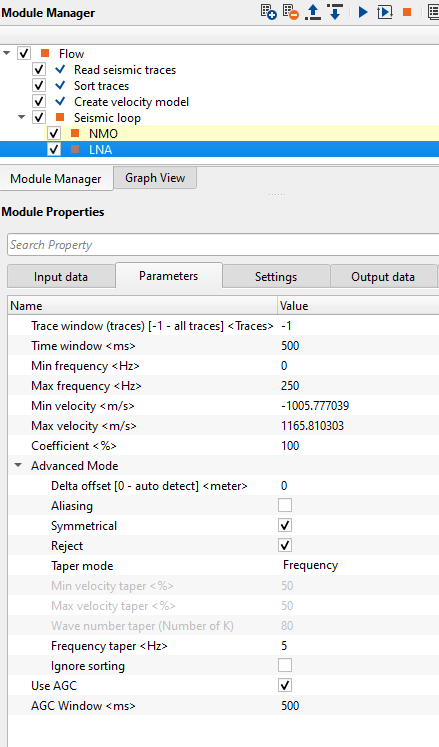
The input gather should be NMO-corrected. Options “Reject” + “Symmetrical” produces more acceptable result. Define frequency range which includes only linear waves for attenuation (estimate by spectral analysis). You can estimate velocity manually by drawing velocity lines by mouse. To do that,
- Go to
 control item icon and select "Selected velocity lines" option.
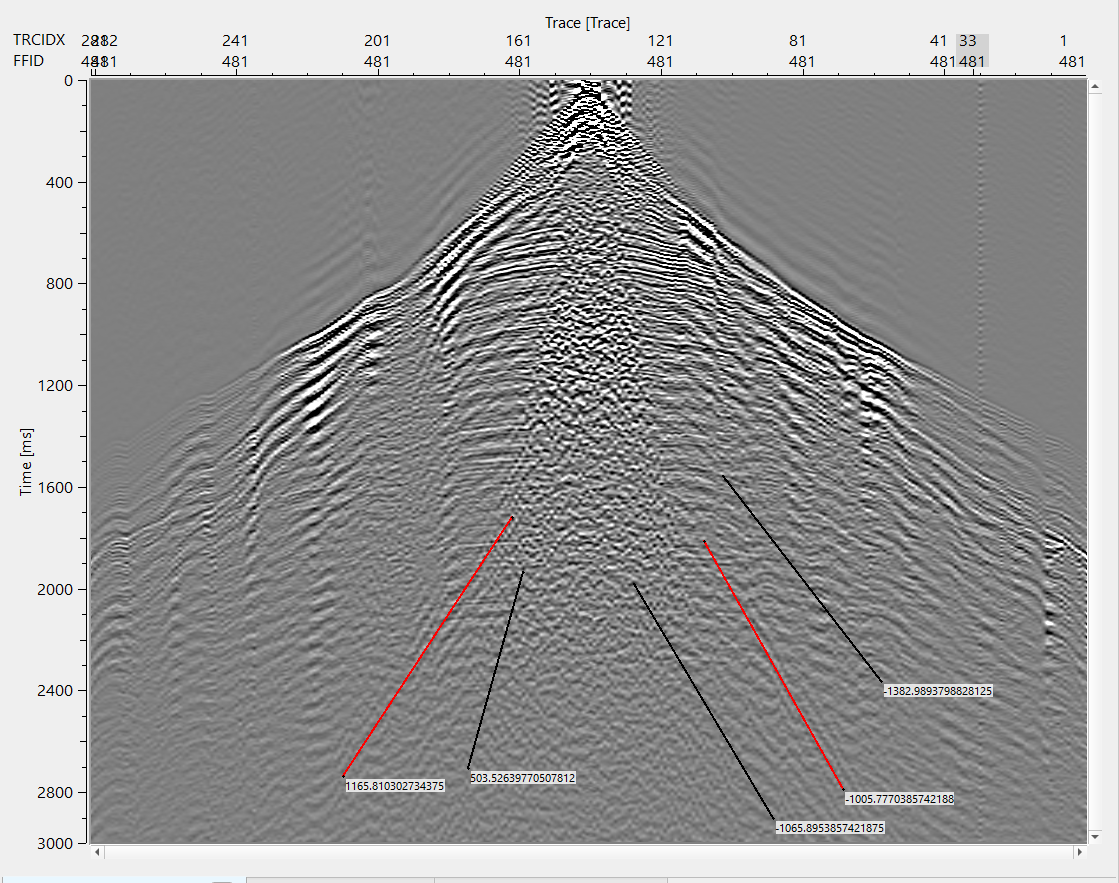
 - Hold MB1 or Left Mouse Button and draw a line. It will draw a straight line in BLACK color.
- Upon double clicking the drawn velocity line, it will turn from BLACK to RED.
- Immediately, it will automatically add/update velocity values in the parameter field (min/max velocity).
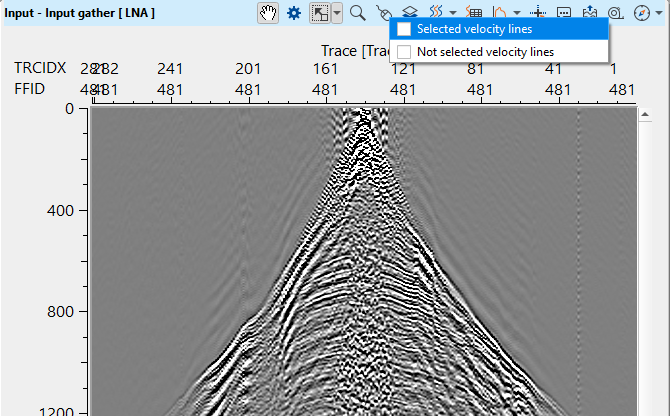
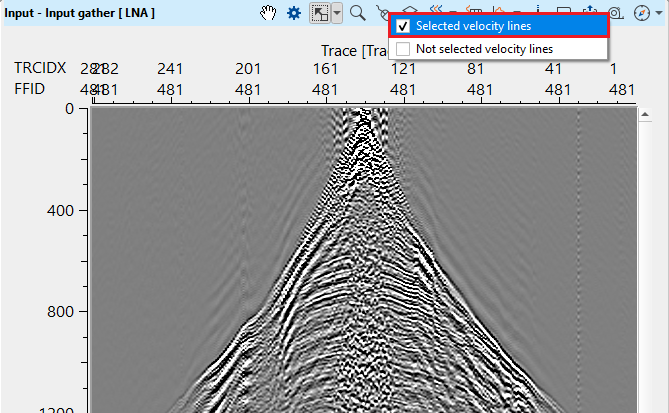
Selected velocities will be RED color as shown in the yellow rectangle box. The other line is Not selected velocity lines. To make it active, double click on this velocity line and it turns to RED.
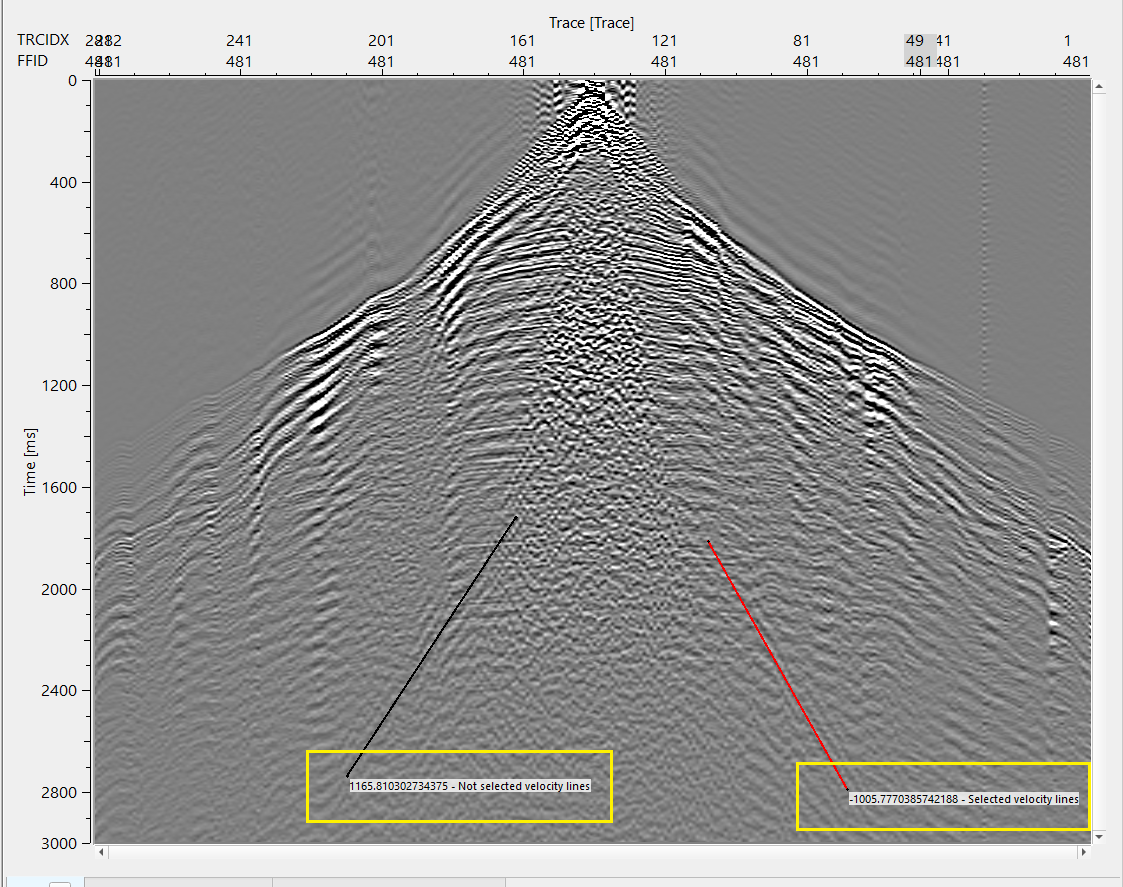
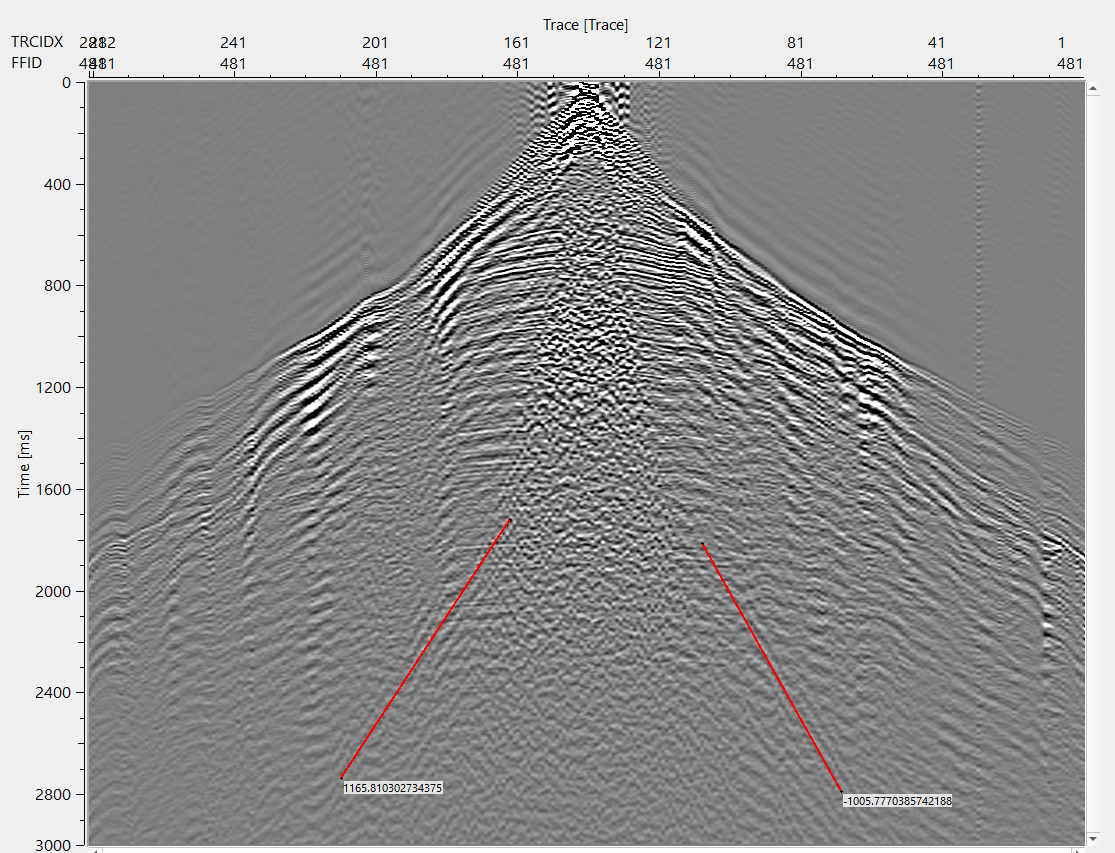
Likewise, the user can draw as many velocity lines as they can however ONLY lines which are RED in color are considered as selected velocity lines. Also, there will be two velocities lines. One for minimum velocity and the other one for maximum velocity.
Test the parameters as per the input data requirement, execute LNA and launch vista items. It generates, Input, Output & Difference displays as shown below.
Actions
There are no action items available for this module so the user can ignore it.
Video lesson
YouTube video lesson, click here to open [VIDEO IN PROCESS...]
Related articles
Yilmaz. O., 1987, Seismic data processing: Society of Exploration Geophysicist
 * * * If you have any questions, please send an e-mail to: support@geomage.com * * *