Frequency filtering
![]()
![]()
This module works in the frequency domain and has a single bandpass filter mode, for the entire trace length, specified as four corner frequency values F1-F2---F3-F4 with smooth slopes. In the frequency domain application, the amplitude spectra of the input seismic trace and the filter operator are multiplied. The main goal of using band-pass operator is passing limited amplitudes via the cut-of frequencies. Where F1-F2 is the first damping slope, F2-F3 is maximum band pass and F3-F4 is the second (end) damping slope. Butterworth filter has monotonic amplitude response in both slopes, which makes it more smoothie, i.e. with less edge oscillations.
The filter is always applied in zero-phase mode: each trace is filtered forward and then backward in time, cancelling any phase shift introduced by the Butterworth response and preserving the wavelet symmetry. This makes it well suited for pre-stack and post-stack amplitude and phase-sensitive workflows. Multi-threaded processing is supported, so the module scales efficiently to large datasets.
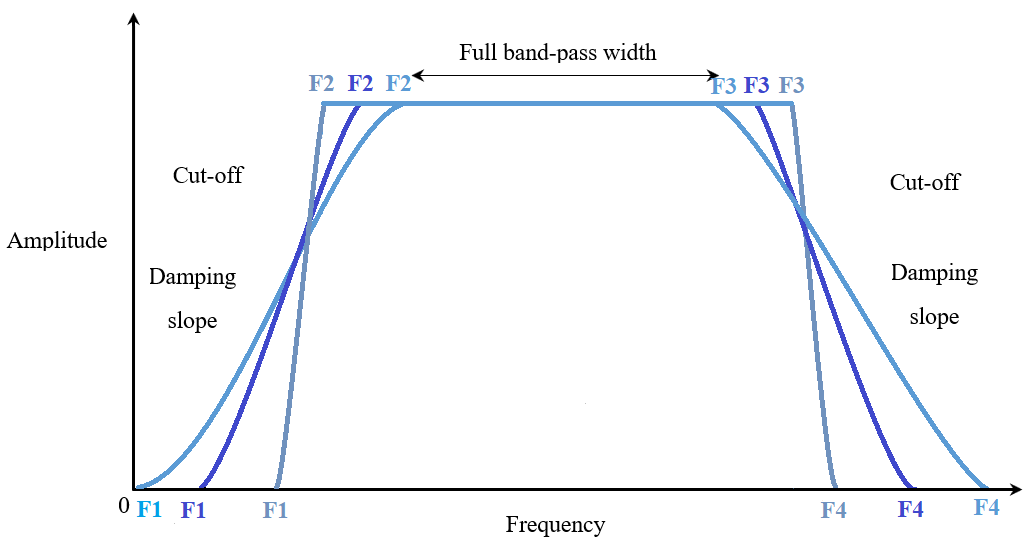
Fig.1 Band-pass spectrum view with different smooth slopes (accuracy of high cut, low pass amplitude).
![]()
![]()
Input gather - connect/reference input seismic traces (prestack or poststack) of any sorting.
Connect the seismic gather to be filtered. The module accepts any gather type — shot gathers, CMP gathers, offset gathers, or stacked sections — with any sample interval and any number of traces. The original trace headers are preserved and passed through unchanged to the output.
![]()
![]()
Low cut stop frequency - specify the starting frequency, start damping slope.
This is the F1 corner frequency in Hz — the lowest frequency in the filter definition. Energy below F1 is fully attenuated (stop band). The slope from F1 up to F2 is the low-frequency roll-on ramp where the filter transitions from full rejection to full pass. Set F1 lower than F2; a typical starting value is 3 Hz (default). For shallow land data with strong low-frequency noise (ground roll residual), you may raise F1 to 5–8 Hz. For deep marine data where low frequencies carry useful signal, keep F1 as low as possible.
Low cut pass frequency - specify full band-pass frequency, end damping slope.
This is the F2 corner frequency in Hz — the frequency at which the low-cut slope reaches the full pass band. From F2 up to F3, the filter passes the signal at full amplitude (pass band). F2 must be greater than F1. The default value is 8 Hz. A narrow gap between F1 and F2 produces a steeper low-frequency slope; a wider gap produces a gentler roll-on. Choose F2 to be just above the lowest frequency of geophysical interest in your dataset.
High cut pass frequency - specify end full band-pass frequency, start damping slope.
This is the F3 corner frequency in Hz — the frequency at which the high-cut roll-off begins. The signal passes at full amplitude from F2 up to F3. Above F3, the filter starts attenuating. F3 must be greater than F2 and less than F4. The default value is 100 Hz. Set F3 to the highest frequency of useful seismic signal, typically estimated from the amplitude spectrum of your data. For vibroseis land data, this is often 60–90 Hz; for marine data, it may extend to 120 Hz or beyond depending on source bandwidth.
High cut stop frequency - specify end frequency, end damping slope.
This is the F4 corner frequency in Hz — the frequency at which the high-cut slope reaches full attenuation (stop band). Energy above F4 is fully rejected. F4 must be greater than F3 and should not exceed the Nyquist frequency of your data. The default value is 105 Hz. A narrow gap between F3 and F4 produces a steeper high-frequency slope; a wider gap produces a gentler roll-off. If you set F4 above the Nyquist frequency, the module automatically clamps it to just below Nyquist.
Accuracy of high cut, low pass Amplitude - frequency damping slopes smoothness, high value - smoothie slope.
This parameter (in percent, range 0.01–10) controls the sharpness of the filter slopes by specifying the residual amplitude level at the stop-band corner frequencies F1 and F4. Internally, the stop-band amplitude target is set to this value divided by 100, and the pass-band amplitude target is set to one minus this fraction. For example, with the default value of 5%, the filter attenuates energy at F1 and F4 to 5% of the pass-band level, while passing energy at F2 and F3 at 95% of the pass-band level. A smaller value (e.g., 1%) produces sharper, steeper slopes with more Butterworth poles — useful when you need tight frequency discrimination but can increase ringing artifacts. A larger value (e.g., 8–10%) produces fewer poles and very smooth, gentle slopes with minimal edge effects. For most standard processing workflows, the default of 5% provides a good balance between selectivity and smoothness.
![]()
![]()
Auto-connection - By default, TRUE(Checked).It will automatically connects to the next module. To avoid auto-connect, the user should uncheck this option.
Bad data values option { Fix, Notify, Continue } - This is applicable whenever there is a bad value or NaN (Not a Number) in the data. By default, Notify. While testing, it is good to opt as Notify option. Once we understand the root cause of it, the user can either choose the option Fix or Continue. In this way, the job won't stop/fail during the production.
Notify - It will notify the issue if there are any bad values or NaN. This will halt the workflow execution.
Fix - It will fix the bad values and continue executing the workflow.
Continue - This option will continue the execution of the workflow however if there are any bad values or NaN, it won't fix it.
Calculate difference - This option creates the difference display gather between input and output gathers. By default Unchecked. To create a difference, check the option.
Number of threads - One less than total no of nodes/threads to execute a job in multi-thread mode. Limit number of threads on main machine.
The Band-pass Butterworth module supports parallel processing using multiple CPU threads. Increasing the number of threads allows the module to filter several traces simultaneously, which significantly reduces processing time on large datasets. Set this to the number of available CPU cores on your machine minus one (to leave one core free for the operating system). For example, on an 8-core machine, a value of 7 is appropriate.
Skip - By default, FALSE(Unchecked). This option helps to bypass the module from the workflow.
![]()
![]()
Output DataItem
Output gather - generates the final output gather after applying Butterworth band pass filter.
The filtered seismic gather with the same geometry, trace count, and sample interval as the input. All trace headers are preserved. The output traces contain only the frequency content within the defined pass band (F2 to F3), with energy outside this band attenuated according to the specified corner frequencies and slope accuracy. Because the filter is zero-phase, no time shifts are introduced to the wavelet.
Gather of difference - generates the difference display gather before and after applying Butterworth band pass filter.
Available only when the Calculate difference option is enabled. This output contains the sample-by-sample difference between the input and filtered gathers, which represents the frequency content that was removed by the filter. Inspecting this gather helps you verify that the filter is removing noise (e.g., ground roll or high-frequency interference) rather than signal, and allows you to assess the quality of the frequency separation.
This section displays quality control statistics for the module execution, such as the number of traces processed and any encountered data issues. Review these statistics after processing to confirm that the expected number of traces were filtered and that no unexpected bad-value events occurred.
![]()
![]()
A test seismic data set is the Poland 2D (land) line, you Poland 2D line that is accessible on the internet free or it is also included to the g-Platform installation (C: \Program Files (x86)\Geomage \gPlatform \demodata\ Poland_2D_Vibroseis_LINE_01).
An example of the workflow for band-pass Butterworth filtering:
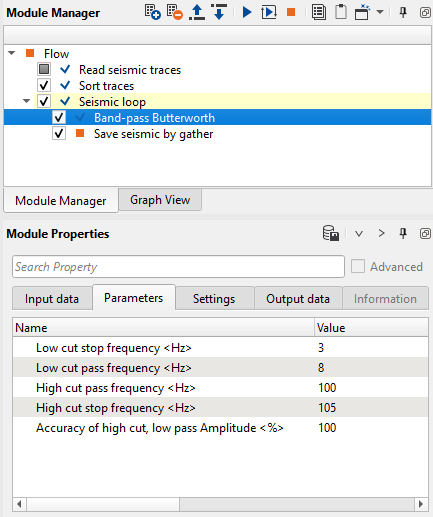
Fig.2 Workflow example.
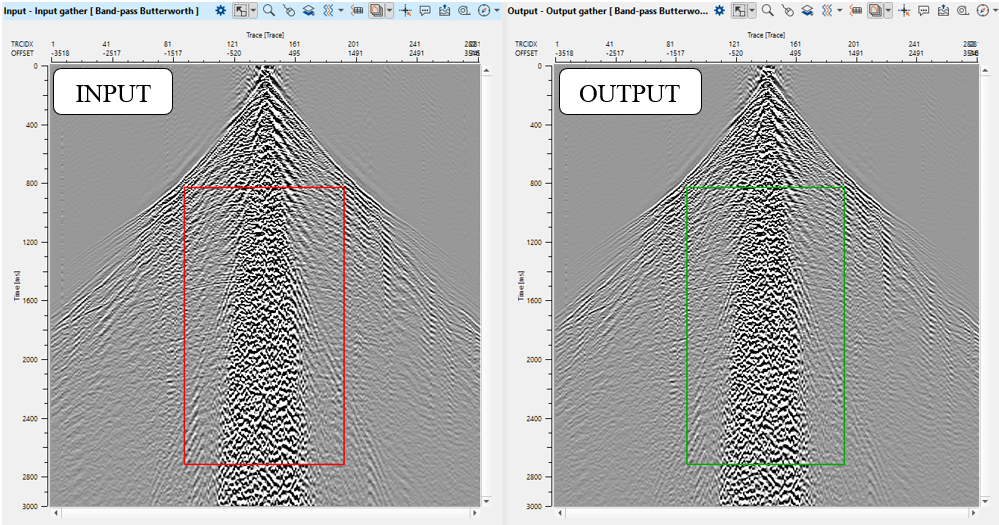
Fig.3 Gathers: input (left) and output (right).
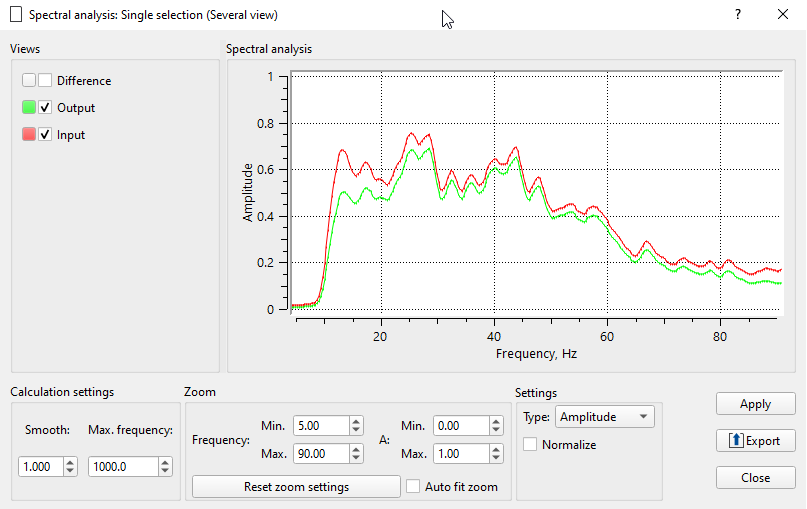
Fig.3 Amplitude frequency spectrum: input (red) and output (green).
![]()
![]()
There are no action items available for this module so the user can ignore it.
![]()
![]()
YouTube video lesson, click here to open [VIDEO IN PROCESS...]
![]()
![]()
Yilmaz. O., 1987, Seismic data processing: Society of Exploration Geophysicists
Oppenheim A. V., and Schafer, R. W., 1975, Digital signal processing
Butterworth, S., 1930, On the Theory of Filter Amplifiers
 If you have any questions, please send an e-mail to: support@geomage.com