Frequency filtering
![]()
![]()
This module works in the frequency domain and has a single bandpass filter mode, for the entire trace length, specified as four corner frequency values F1-F2---F3-F4. In the frequency domain application, the amplitude spectra of the input seismic trace and the filter operator are multiplied. The main goal of using band-pass operator is passing limited amplitudes via the cut-of frequencies. Where F1-F2 is the first damping slope, F2-F3 is maximum band pass and F3-F4 is the second (end) damping slope.
The filter shape is trapezoidal (polygonal): amplitude rises linearly from zero at F1 to full amplitude at F2, remains flat from F2 to F3, then tapers linearly back to zero at F4. Frequencies outside the F1-F4 range are fully suppressed. The four corner frequencies must satisfy F1 <= F2 <= F3 <= F4; the module will report an error if this ordering is violated. The filter is applied to every trace in the input gather independently, using an FFT-based frequency-domain multiplication for efficiency. Multi-thread execution is supported to accelerate processing of large gathers.
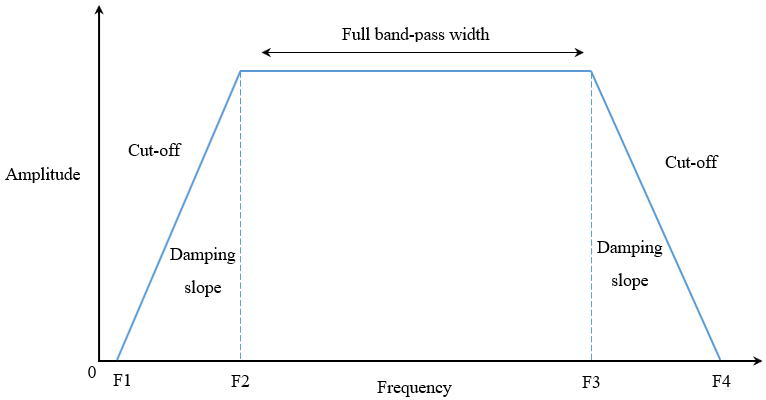
Fig.1 Band-pass spectrum view.
![]()
![]()
Input DataItem
Input gather - connect/reference to input seismic traces (prestack or poststack) of any sorting.
![]()
![]()
Frequency 1 - start frequency, start damping slope.
The low-cut onset frequency, in Hz. Below this frequency all energy is completely suppressed. The amplitude ramp begins here and rises from zero toward full amplitude. Must be greater than or equal to zero and less than or equal to Frequency 2. Default value: 1 Hz. For typical land reflection data, values in the range of 2-8 Hz are common to suppress very low-frequency ground roll energy while retaining the shallow reflection content. Set to 0 to pass all frequencies from DC.
Frequency 2 - start full band-pass frequency, end damping slope.
The low-cut end frequency, in Hz. From this frequency up to Frequency 3 the filter passes all energy at full amplitude (the flat passband top). The amplitude ramp from Frequency 1 reaches its maximum at this point. Must be greater than or equal to Frequency 1 and less than or equal to Frequency 3. Default value: 5 Hz. A wider ramp (larger gap between F1 and F2) produces a gentler, smoother transition and reduces Gibbs ringing; a narrower ramp is steeper but may introduce filter artefacts.
Frequency 3 - end full band-pass frequency, start damping slope.
The high-cut onset frequency, in Hz. At this frequency the amplitude begins to taper from full amplitude down toward zero. This defines the upper edge of the flat passband. Must be greater than or equal to Frequency 2 and less than or equal to Frequency 4. Default value: 200 Hz. Set this to a value somewhat below the Nyquist frequency of the data to suppress high-frequency noise and prevent aliasing artefacts. For typical seismic data sampled at 2 ms (Nyquist = 250 Hz), values of 80-120 Hz are commonly used.
Frequency 4 - end frequency, end damping slope.
The high-cut end frequency, in Hz. Above this frequency all energy is fully suppressed. The amplitude ramp initiated at Frequency 3 reaches zero here. Must be greater than or equal to Frequency 3. Default value: 210 Hz. For best results, keep F4 at or below the Nyquist frequency of the recorded data. A wider rolloff (larger gap between F3 and F4) gives a smoother high-frequency cut; setting F3 equal to F4 creates a brick-wall cut at that frequency, which can introduce ringing on the output traces.
![]()
![]()
Auto-connection - By default, TRUE(Checked).It will automatically connects to the next module. To avoid auto-connect, the user should uncheck this option.
Bad data values option { Fix, Notify, Continue } - This is applicable whenever there is a bad value or NaN (Not a Number) in the data. By default, Notify. While testing, it is good to opt as Notify option. Once we understand the root cause of it, the user can either choose the option Fix or Continue. In this way, the job won't stop/fail during the production.
Notify - It will notify the issue if there are any bad values or NaN. This will halt the workflow execution.
Fix - It will fix the bad values and continue executing the workflow.
Continue - This option will continue the execution of the workflow however if there are any bad values or NaN, it won't fix it.
Calculate difference - This option creates the difference display gather between input and output gathers. By default Unchecked. To create a difference, check the option.
Number of threads - One less than total no of nodes/threads to execute a job in multi-thread mode. Limit number of threads on main machine.
Skip - By default, FALSE(Unchecked). This option helps to bypass the module from the workflow.
![]()
![]()
Output gather - generates the band pass filter applied output gather.
Gather of difference - generates the difference gather display before and after applying band pass filter.
There is no information available for this module so the user can ignore it.
![]()
![]()
A test seismic data set is the Poland 2D (land) line, you Poland 2D line that is accessible on the internet free or it is also included to the g-Platform installation (C: \Program Files (x86)\Geomage \gPlatform \demodata\ Poland_2D_Vibroseis_LINE_01).
An example of the workflow for band-pass filtering:
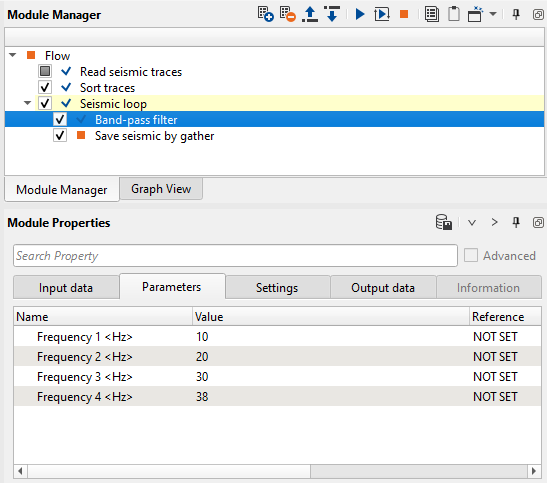
Fig.2 Workflow example.
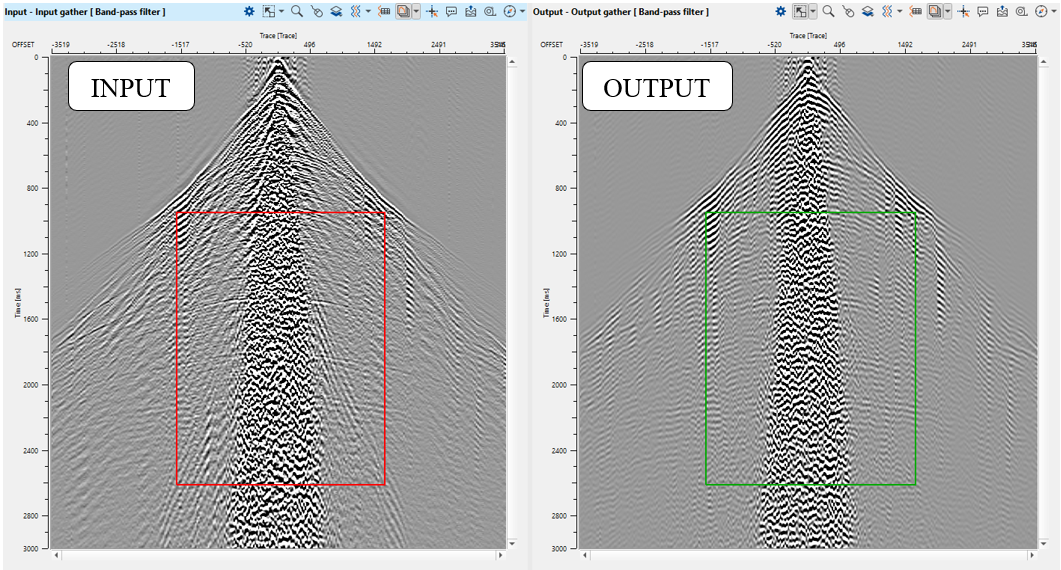
Fig.3 Gathers: input (left) and output (right).
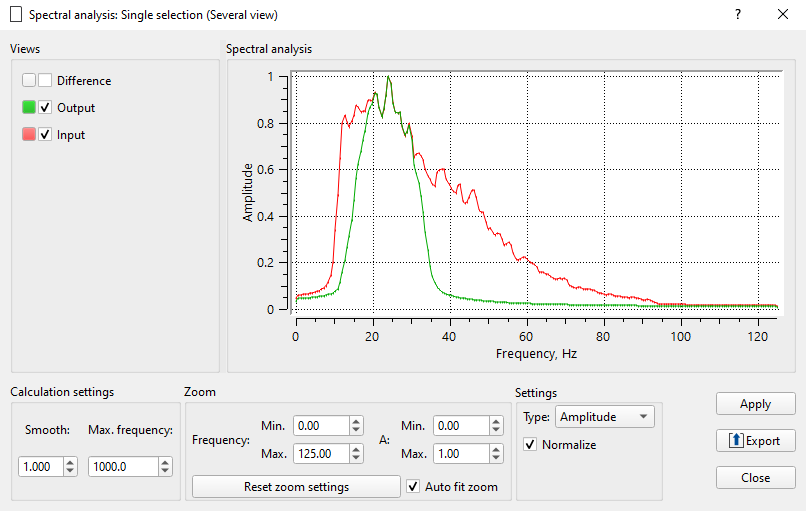
Fig.3 Amplitude frequency spectrum: input (red) and output (green).
![]()
![]()
There are no action items available for this module so the user can ignore it.
![]()
![]()
YouTube video lesson, click here to open [VIDEO IN PROCESS...]
![]()
![]()
Yilmaz. O., 1987, Seismic data processing: Society of Exploration Geophysicists
Oppenheim A. V., and Schafer, R. W., 1975, Digital signal processing
 If you have any questions, please send an e-mail to: support@geomage.com