Read ASCII files with x-y-z column format (horizons and other attributes)
![]()
![]()
This module is designed to read ASCII text files in a columnar format and load them into a processing environment. The data from the file can then be used to create various visual representations, such as contour maps or horizon plots, based on the interpretation results provided by interpreters:
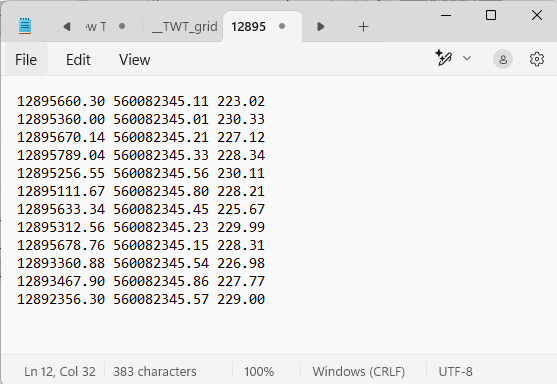
The ASCII input file format is flexible and allows users to select which columns to use for different coordinate axes. Specifically, the user can designate one column for the X value, which will be displayed along the horizontal axis, one for the Y value, displayed along the vertical axis, and one for the Z value, which will be represented by color. The module also enables the user to choose a column to serve as the KEY. Example of XYZ ASCII file:
When the KEY value changes, a separate item is created in the visualization, which can be customized with different symbols. The visibility of these items can be toggled on and off within the Location Map view, allowing for better control over the displayed data. Additionally, data with the same KEY value can be grouped together, enabling selective display and easier analysis. This capability supports various use cases, including displaying horizon picks interpreted in a seismic interpretation package, and mapping them effectively in the location context.
![]()
![]()
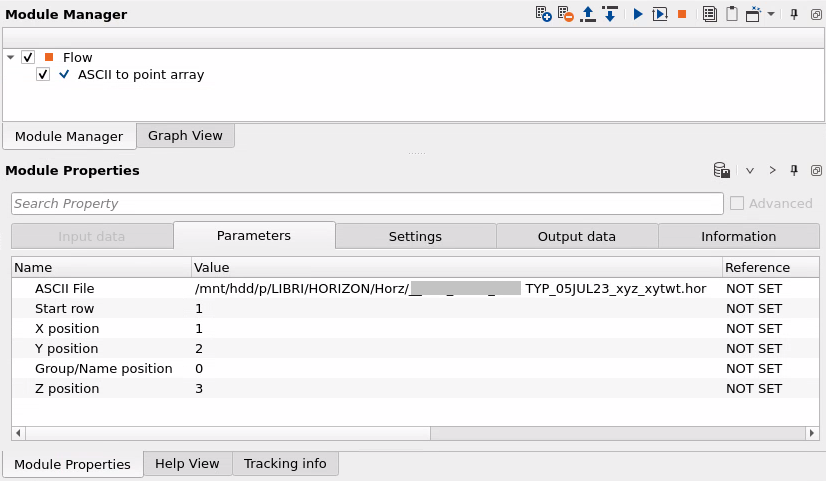
ASCII File - full path and name of input ASCII file. Format is text, *.txt.
Start row - number of a the first row for starting to read a file. For example if we need to skip some information header in the file which consists of 3 rows, define this parameter = 4 (start read from 4th row).
X position - sequential number of column containing values to use along the horizontal X axis (x coordinate).
Y position - sequential number of column containing the value to use along the vertical Y axis (y coordinate).
Group/Name position - sequential number of the column containing the KEY designation (time or depth for horizon, elevations etc).
Z position - Sequential number of column containing the Z value that will can be represented as a color.
![]()
![]()
Skip - By default, No (Unchecked). This option helps to bypass the module from the workflow (i.e. do not execute).
![]()
![]()
Output point vector - this module generates a vector of points that were loaded from ASCII file, so this vector can be used for creation a map via.
![]()
![]()
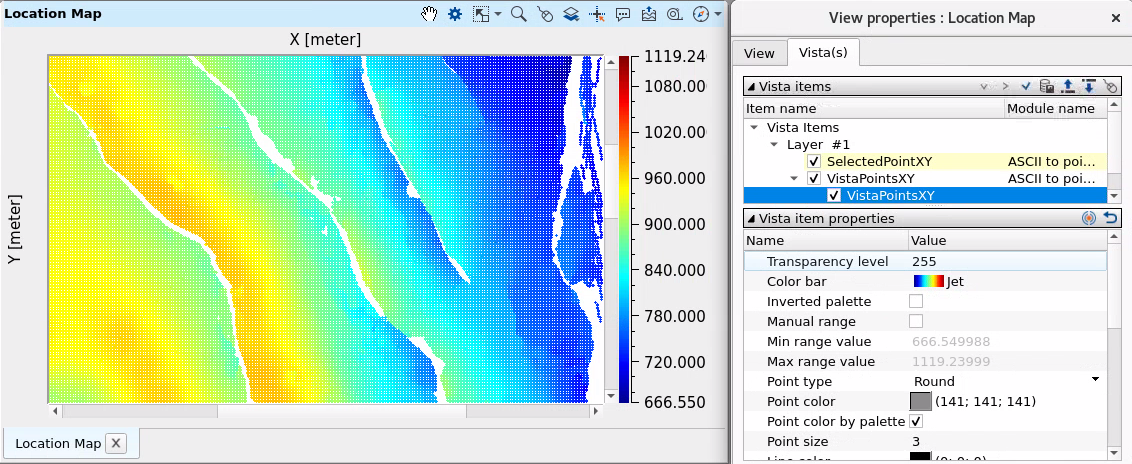
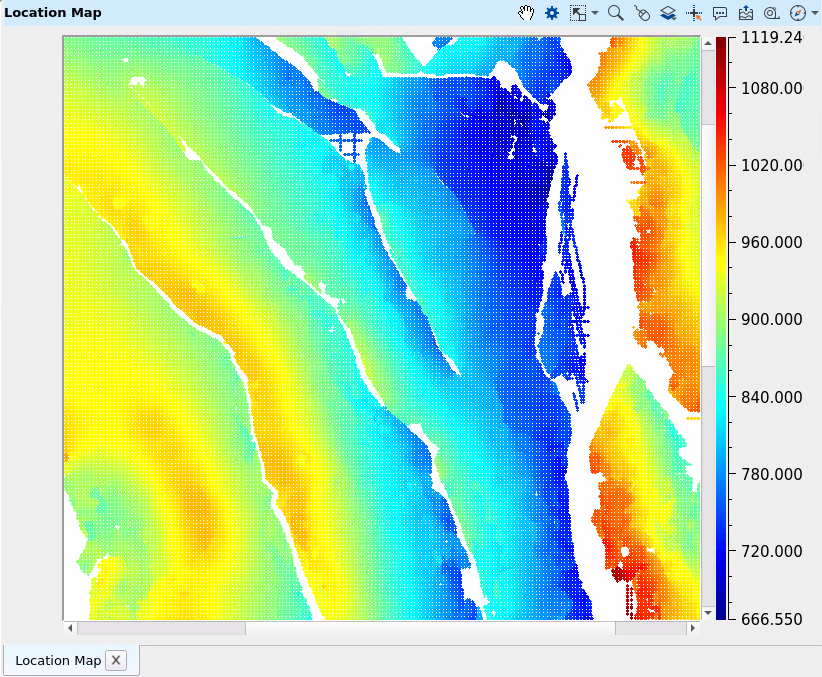
Example of a workflow, read ASCII file with horizon that was picked in the interprets software:
Open Location map visual vista from the module, this is points (picks) of 1 horizon: