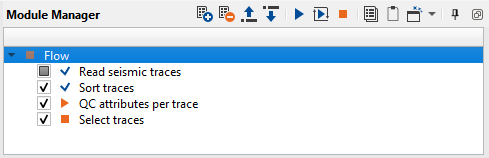
Auto trace editing (QC Attributes +Select traces)
![]()
![]()
This module is based on QC Attributes module, because the basis is seismic attribute calculation and estimation. The QC attributes per trace module calculates necessary types of attributes per trace like RMS amplitudes, Mean amplitudes, Dominant frequency and other. User should analyze those values and create selection equation for auto trace editing. For example, we can remove zero traces or low amplitude traces, remove harsh/high amplitude noisy useless traces, sources, receivers and so on. Many seismic attributes and complex user's equations will lead to a flexible and successful auto trace editing workflow. All seismic attributes are saved into trace headers on the output data set and we can use these trace headers for further selection equation via Select traces module. Therefore, we need to use both modules for auto trace editing:
1) QC Attributes (calculation);
2) Select traces (selection).
The list of trace headers and their equivalents of calculated attributes:
• MAXIMUM_AMPLITUDE: Maximum amplitudes;
• MINIMUM_AMPLITUDE: Minimum amplitudes;
• MAXIMUM_ABS_AMPLITUDE: Maximum abs amplitudes;
• MINIMUM_ABS_AMPLITUDE: Minimum abs amplitudes;
• RMS_AMPLITUDE: RMS amplitudes;
• AMPLITUDE_ARITHMETICAL_MEAN_ABS_VALUE: Amplitudes arithmetical mean abs value;
• STANDARD_DEVIATION: Amplitudes standard deviation;
• DOMINANT_FREQUENCY: Dominant frequency (RMS);
• FREQUENCY_RANGE: Spectrum width;
• MEAN_FREQUENCY: Mean frequency;
• SIGNAL_NOISE: Signal/Noise RMS;
• SIGNAL_NOISE_AMPLITUDE: Signal/Noise amplitudes.
![]()
![]()
Update map - update maps values (source, receiver, bin).
![]()
![]()
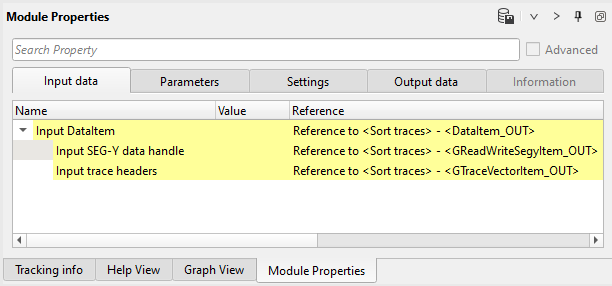
SEG-Y data handle - input seismic gather.
Input trace headers - trace header vector.
![]()
![]()
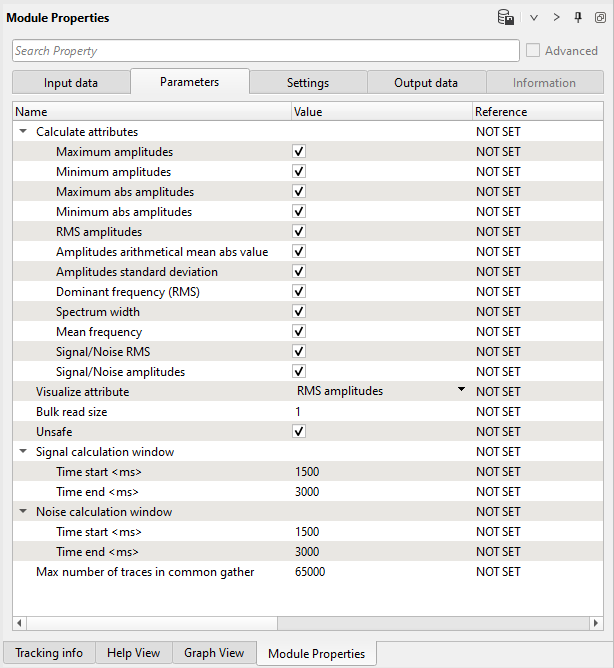
Attributes
List of attributes that can be shown on a location map
Maximum amplitudes
Check box to turn on/off maximum amplitudes calculation
Minimum amplitudes
Check box to turn on/off amplitudes arithmetical mean absolute value calculation
Maximum abs amplitudes
Check box to turn on/off Maximum abs amplitudes calculation
Minimum abs amplitudes
Check box to turn on/off minimum abs amplitudes calculation
RMS amplitudes
Check box to turn on / off RMS amplitudes calculation
Amplitudes arithmetical mean abs value
Check box to turn on / off amplitudes arithmetical mean absolute value calculation
Amplitudes standard deviation
Check box to turn on/off amplitudes standard deviation calculation
Dominant frequency (RMS)
Check box to turn on/off dominant frequency calculation
Spectrum width
Check box to turn on/off spectrum width calculation
Mean frequency
Check box to turn on/off mean frequency calculation
Signal/Noise RMS
Check box to turn on/off Signal/Noise RMS calculation
Signal/Noise amplitudes
Check box to turn on/off Signal/Noise amplitudes calculation
Signal calculation window
Window size parameters for calculation for signal
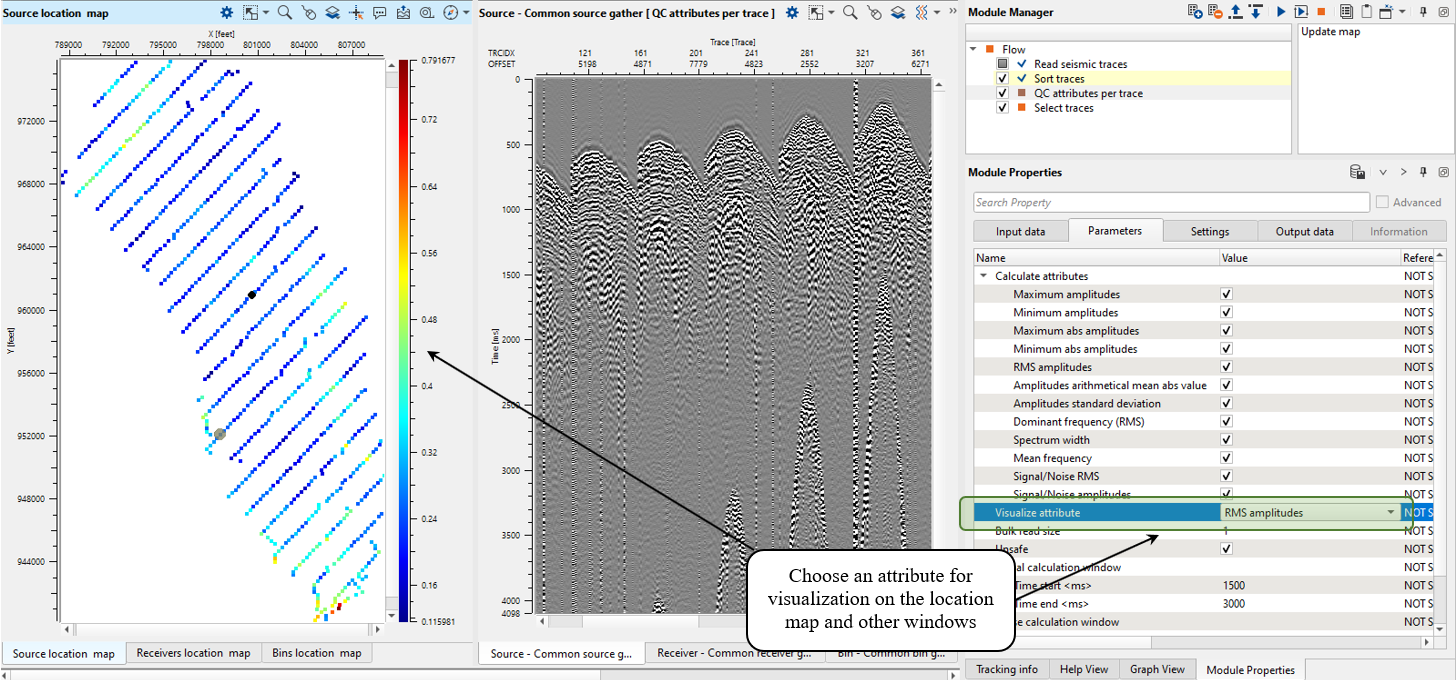
Visualize attribute
The same list of attributes for visualization
Bulk read size
Chunk (portion) of traces for consistent reading
Signal calculation window
Time start <ms>
Time end <ms>
Noise calculation window
Time start <ms>
Time end <ms>
Max number of traces in common gather
Limitation of amount of traces for case when there is only one gather for the entire data set, therefore we shouldn't upload all traces in RAM.
![]()
![]()
Skip - switch-off this module (do not use in the workflow).
Auto-connection - module is connected with previous (and next) modules in the workflow by default.
SEG-Y read params - optimizing parameters for reading traces from disk:
Thread count (for SSD) - number of threads in case of using SSD disk.
Bulk size (traces) - Chunk (portion) of traces for consistent reading.
Number of threads - perform calculation in the multi-thread mode.
![]()
![]()
Output calculated attributes - seismic attributes (trace headers).
![]()
![]()
A test seismic data set is 3D land seismic data set. It is open data, you can download an input set from the following link: https://wiki.seg.org/wiki/Teapot_dome_3D_survey. In the example data set there is and spherical divergence corrections were applied.
The basis example of the workflow:
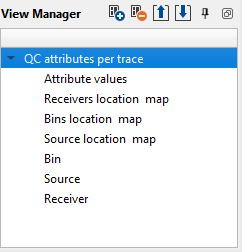
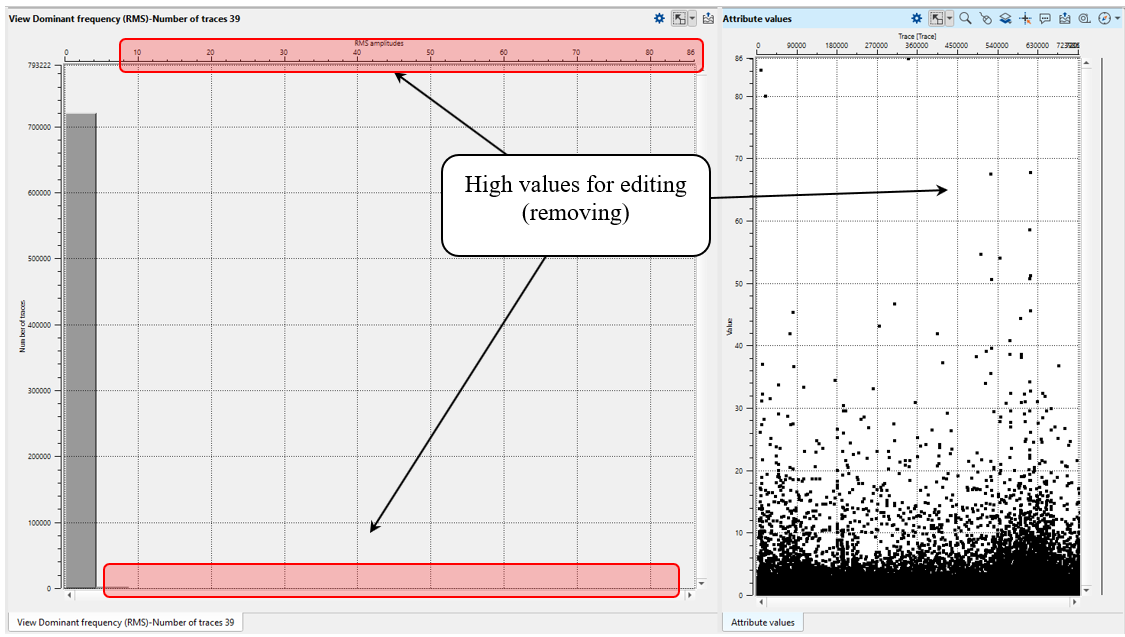
Execute the module and open all vista groups:
Analyze high values for further removing:
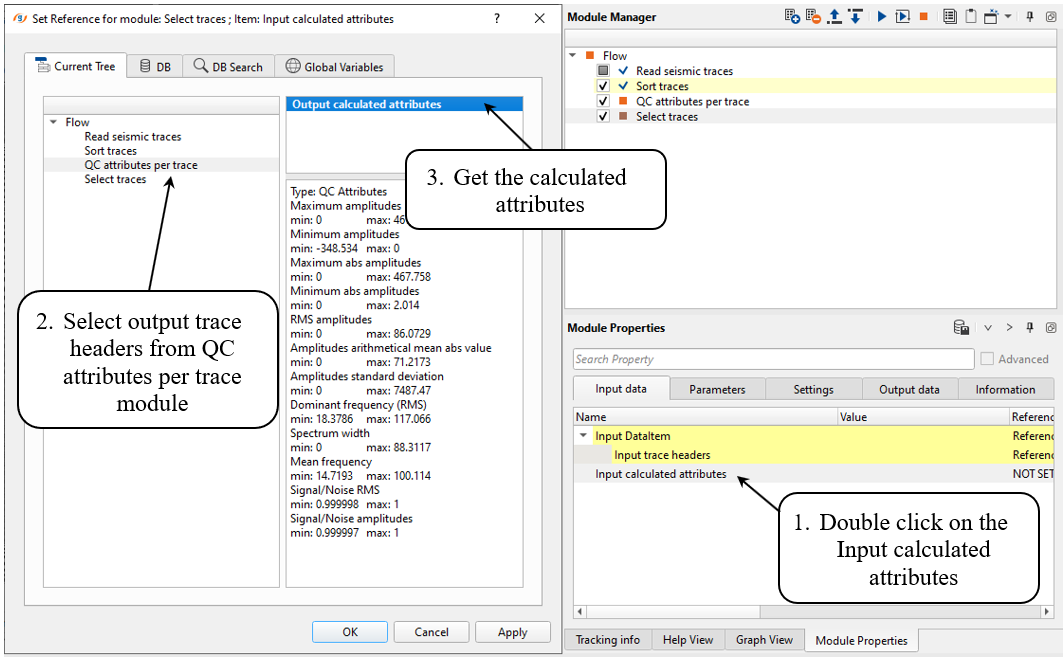
After execution we have output trace header vector as result with new headers (attributes) that were chosen for calculation. So, the next step is using those headers for selection creation.
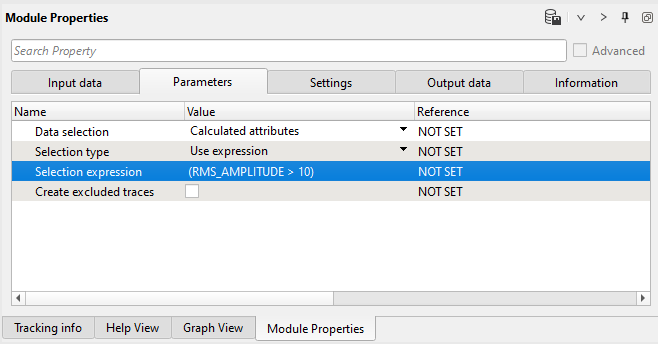
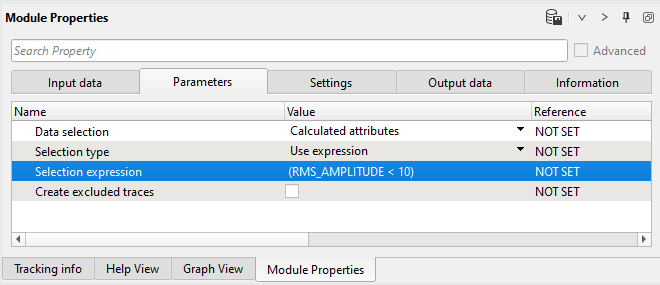
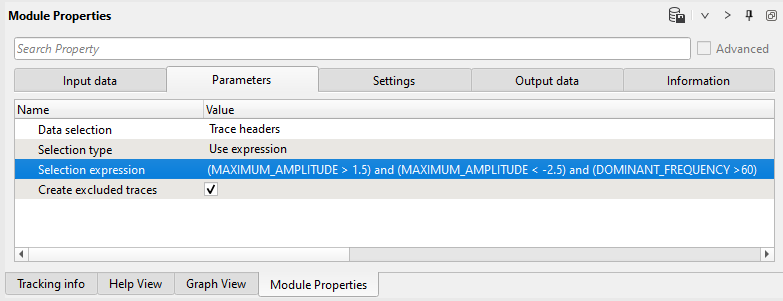
Add Select traces module and define and necessary parameters as shown below:
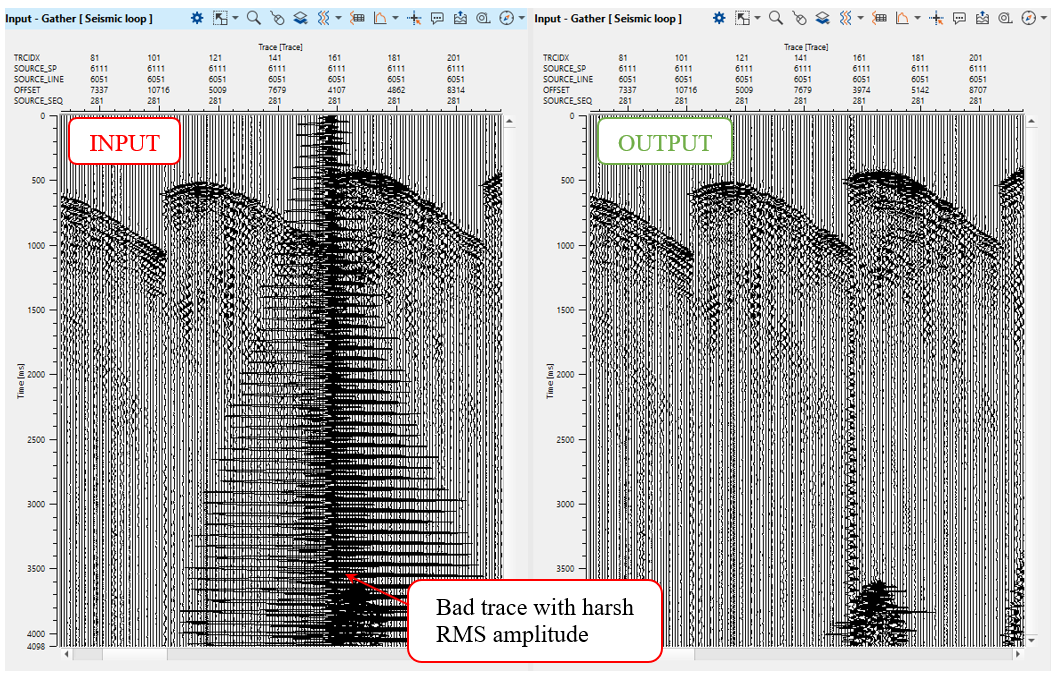
Lets select bad traces which have harsh RMS amplitude values. For selection you can use free-expression (example below) or expression by table.
Define selection expression as shown below and execute the module:
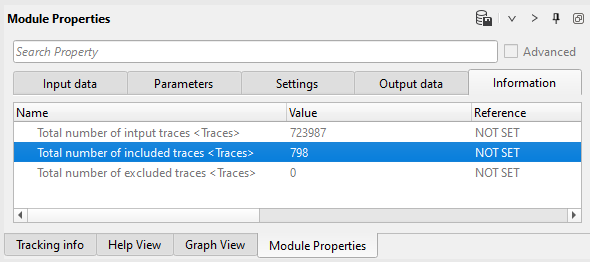
Check statistics in the Information tab. So, 798 traces were selected as bad traces and we can look at them:
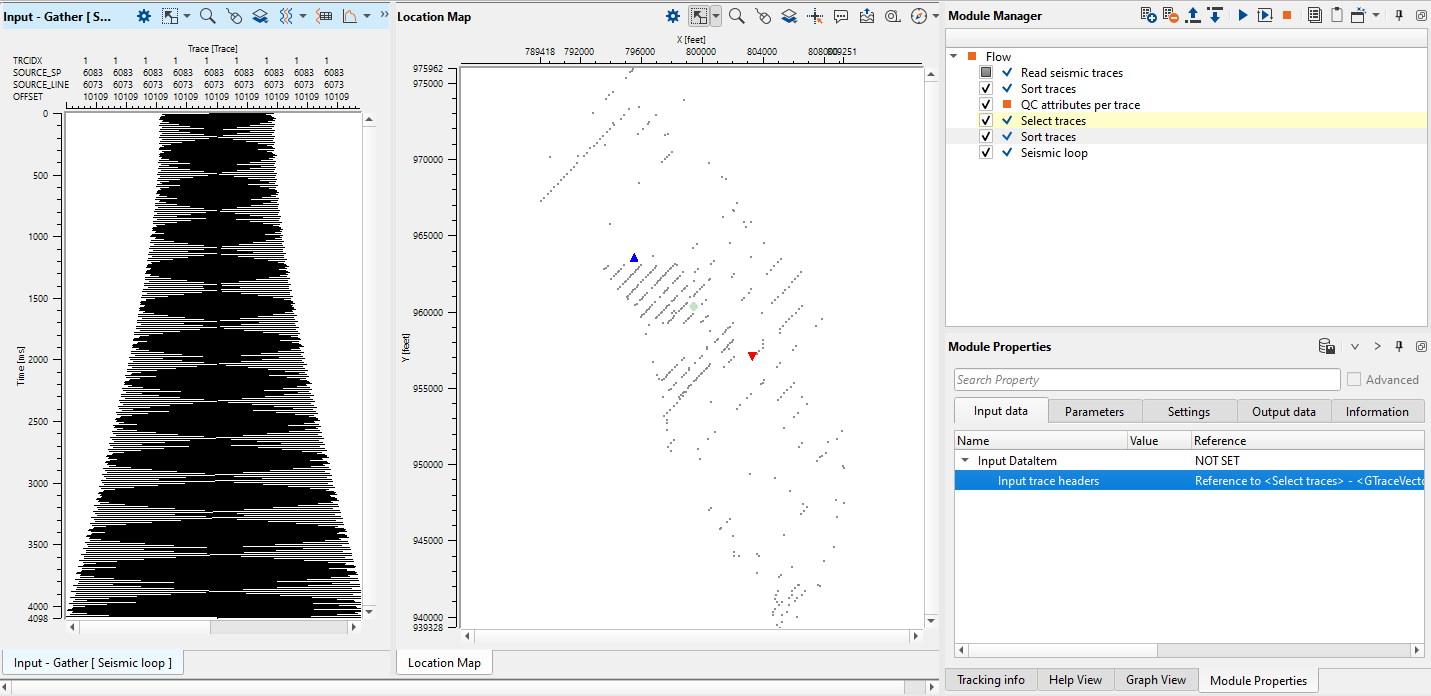
Use Seismic loop for checking bad traces. Get the output trace headers vector from the Select traces module and use location map and gather view from Seismic loop for analyzing bad traces as shown below::
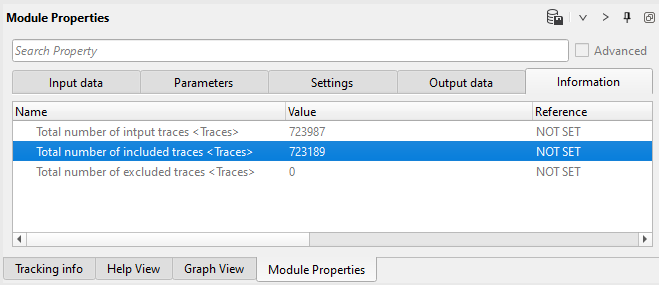
If we satisfied there is a last step: write good traces into file. Use seismic loop also, you just need to change the expression in Select traces module for selection good traces:
Check the output trace statistic again:
Execute Seismic loop for the entire data (press ![]() button from upper menu):
button from upper menu):
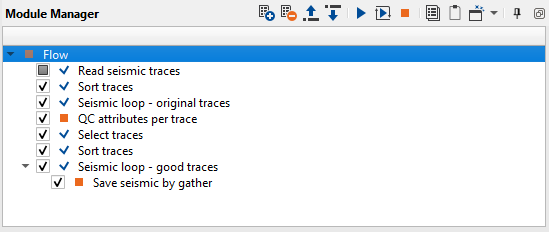
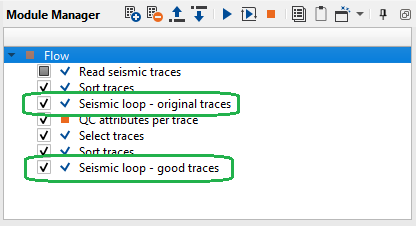
You can create two gather views: before and after auto trace editing, by using two Seismic loop modules:
Notice that you can create complex expression by merging several selections:
![]()
![]()
YouTube video lesson, click here to open [VIDEO IN PROCESS...]
![]()
![]()
* * * If you have any questions, please send an e-mail to: support@geomage.com * * *