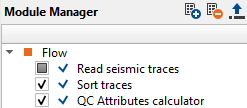
QC is an integral and important part in seismic data processing/imaging. At each stage, the user should QC the data to make sure that all the information going to the next stage is correct. In g-Platform processing suite we have various QC modules available depending on their objective.
To measure and display the QC attributes we have few modules which are
•QC Attributes calculator
•QC Attributes
•Seismic Instantaneous attributes
•Signal to Noise ratio
•Spectral Analysis etc
•
We are going to discuss briefly about some of these modules.
QC Attributes calculator
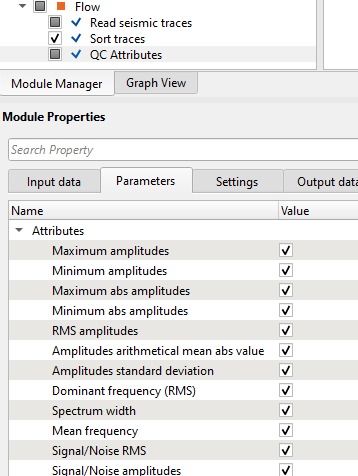
In this module, the user can connect/reference the necessary input data. As per the sorting order, it generates the QC attributes. In this module, we can to Calculate these attributes as shown in the below image (Red square)
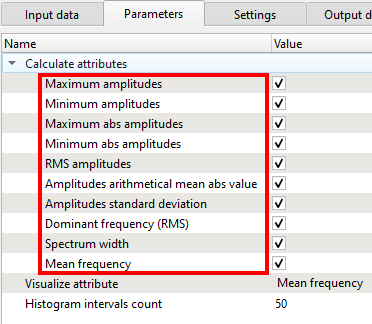
Depending on the user's requirement, either all the attributes can be calculated by checking all options or select only those are need to be calculated.
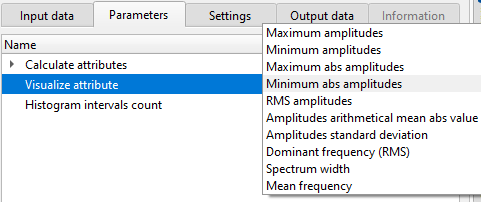
Visualize attribute parameter displays the respective attribute as vista items.
Similarly, the user can to calculate and display the other QC attributes using QC Attributes calculator module.
QC Attributes
In this module, we can to define the signal and noise window to do the analysis. Also we can run this module on both Pre and Post stack data.
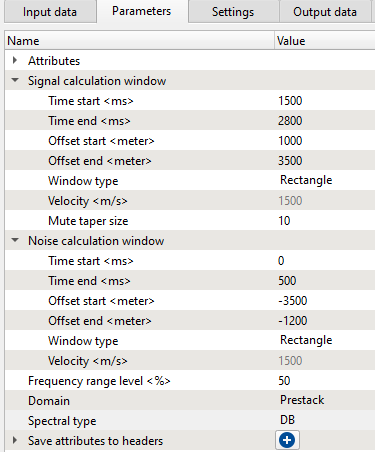
Under the Signal calculation & Noise calculation window, define the window parameters. We can also choose the Window type as "Rectangle" or "Hyperbolic". Make sure to check the Domain as "Prestack" or "Post stack".
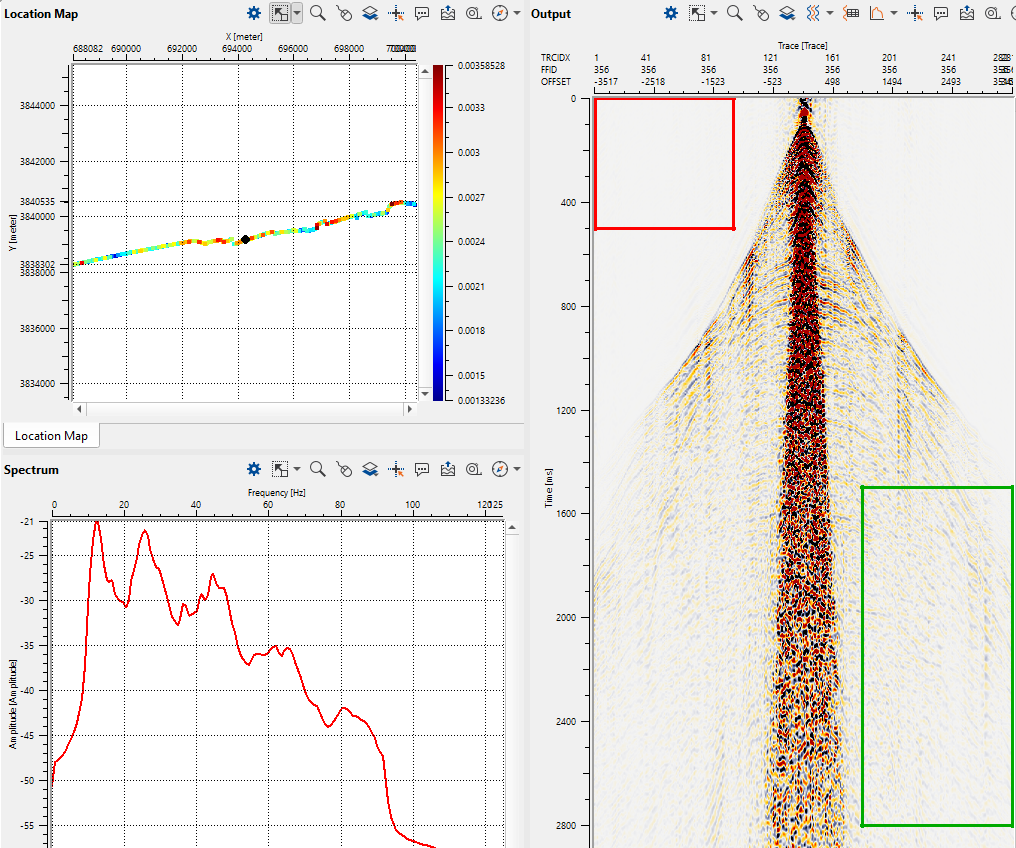
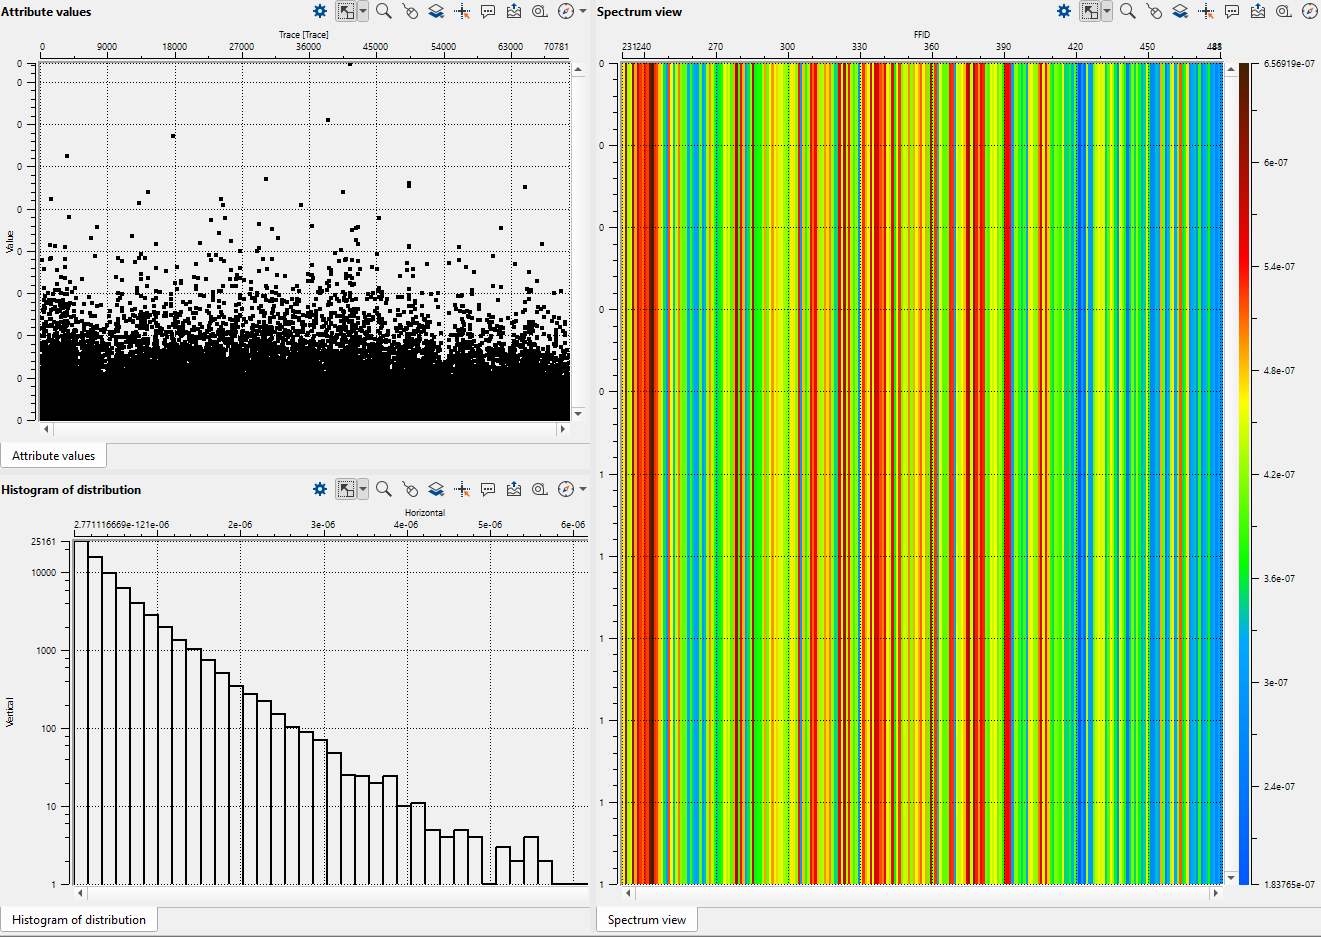
When we generate the Vista items, we get Location map, Spectrum and Output vista items. Click on ![]() icon of the Location map window. In View Properties window, we can to see all the Attributes generated by QC attributes module. User should check/uncheck the box to display the respective attribute maps.
icon of the Location map window. In View Properties window, we can to see all the Attributes generated by QC attributes module. User should check/uncheck the box to display the respective attribute maps.
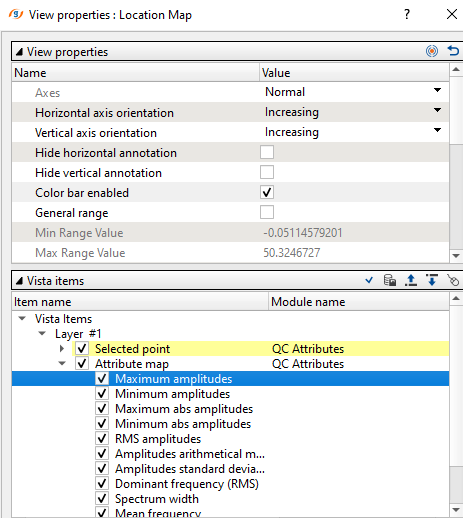
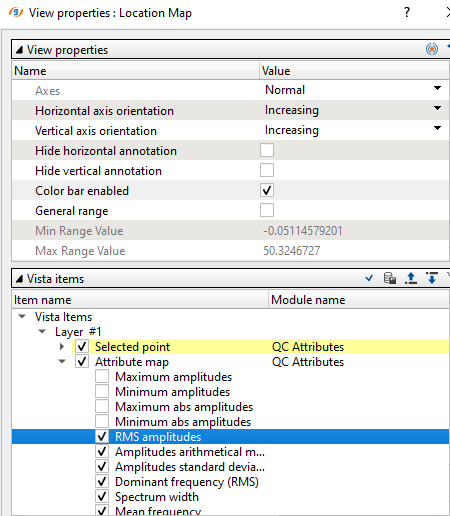
In the above image, we can see all the attributes. For instance, the user wants to QC the RMS amplitudes then they need to uncheck the QC attributes items above the RMS amplitudes. Now if we look at the location map, it will display the RMS amplitudes. Besides the spectrum and Output gather with Noise & Signal windows.