 Swell noise attenuation
Swell noise attenuation
|
<< Click to Display Table of Contents >> Navigation: Tutorials > Seismic Processing 2D MARINE >
|
One of the common noise in marine seismic is swell noise. This noise is caused by the swell of the waves. Typical characteristics of the Swell noise is high amplitudes and low frequencies. Swell noise looks like a vertical line in the shot gathers. There are various methods to attenuate the swell noise.
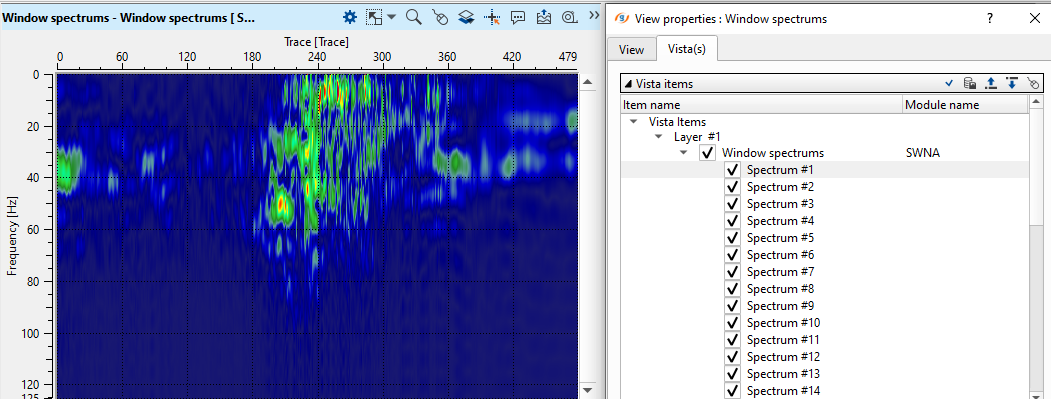
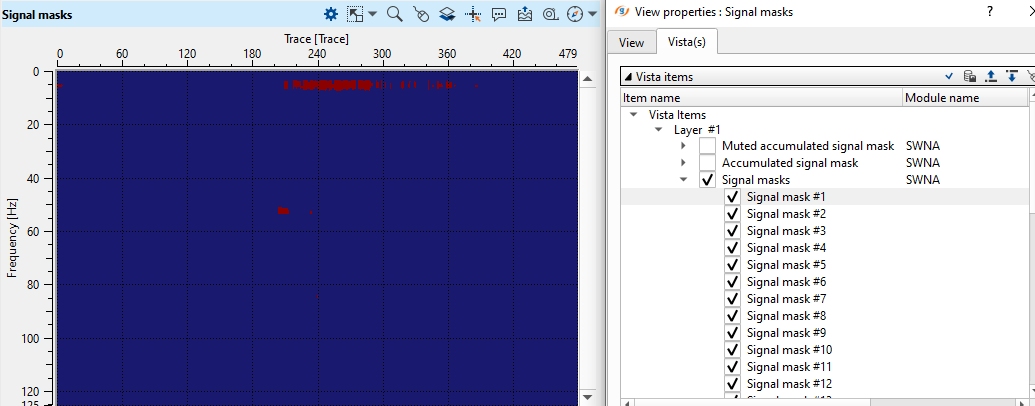
SWNA (Swell Noise Attenuation) module is used to attenuate the marine swell noise. In this, we transform the data from T-X domain to F-X domain. Within the F-X domain, we calculate the frequency spectrum for each sample within the user defined window. After that, these spectral windows are converted as signal masks. The total number of signal masks depends on the start window and window step.
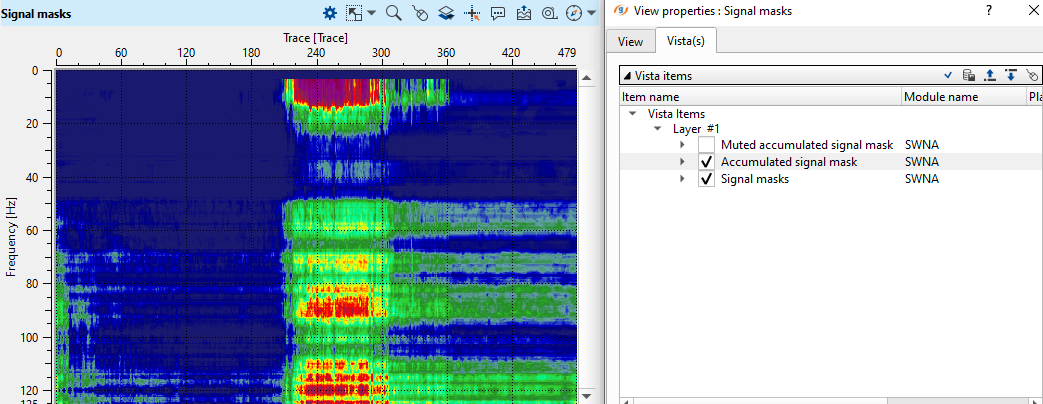
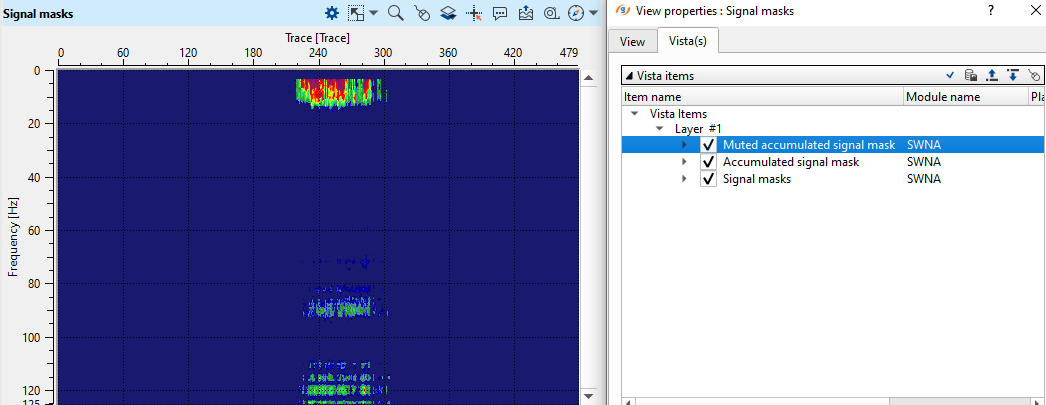
All these signal masks are accumulated as a single signal mask. Later all the non-zero (signal as zero) samples of accumulated signal mask is considered as noise.
We try to estimate the exponential probability distribution of both signal and noise components. This function is characterized by mean amplitude. We try to estimate the mean amplitude of the signal and noise by an iterative process. We compare the mean amplitude of the signal's previous iteration and current iteration. Similarly to the noise component. Based on the noise selection threshold and noise detection probability threshold, we scale down the mean amplitude of the noise to equal or close to equal of mean amplitude of signal. The process stops when the difference between the signal and noise mean amplitudes are less than the defined tolerance value.
Please make a note of it that attenuate any noise above the water bottom so that it won't be part of the calculation.
Create a workflow 0070-swell-noise-attenuation
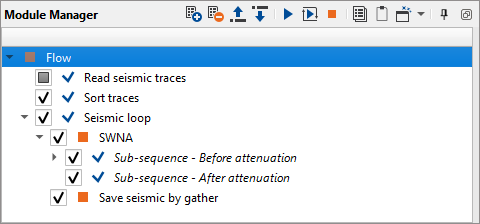
1. Read seismic traces
2. Sort traces
3. Seismic loop
4. SWNA
5. Save seismic by gather
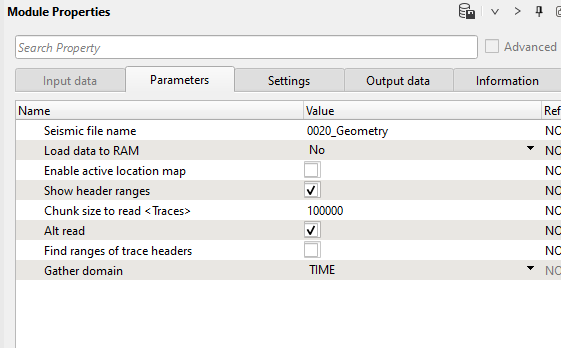
1) Read seismic traces loads seismic trace from the previous step, input file name is 0020_Geometry. Execute the module by double click on it or press on run button ![]() from the upper menu.
from the upper menu.
Define module parameters:
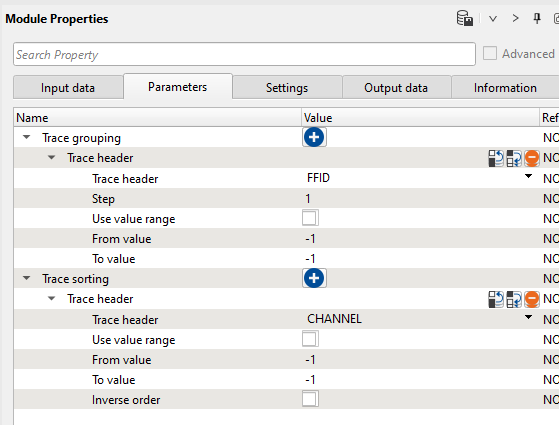
2) Sort traces Here we need to sort seismic traces for Seismic loop. Add Sort traces module and set FFID header for Trace Grouping and CHANNEL as Trace Sorting as it is shown below
3) Seismic loop Connect trace headers vector (Input sorted headers) from the Sort traces module output and seismic (Input SEG-Y data handle) from Read seismic traces.
4) SWNA Swell Noise Attenuation module attenuates the swell noise. Here we have sub-sequence procedure to apply further processing sequence before and after noise attenuation.
Time window
This is the main calculation window to calculate the frequency spectrum of the defined window. This is the height/vertical
window of the frequency spectrum.
Start time
Define the start time for the frequency spectrum calculation. Depending on the Start time and Window step size, the total signal masks will vary. For example if the start time is 2000ms (total record length is 6000ms) and the window step size is 50ms then the total signal masks will be (6000-2000)/50ms = 80 signal masks.
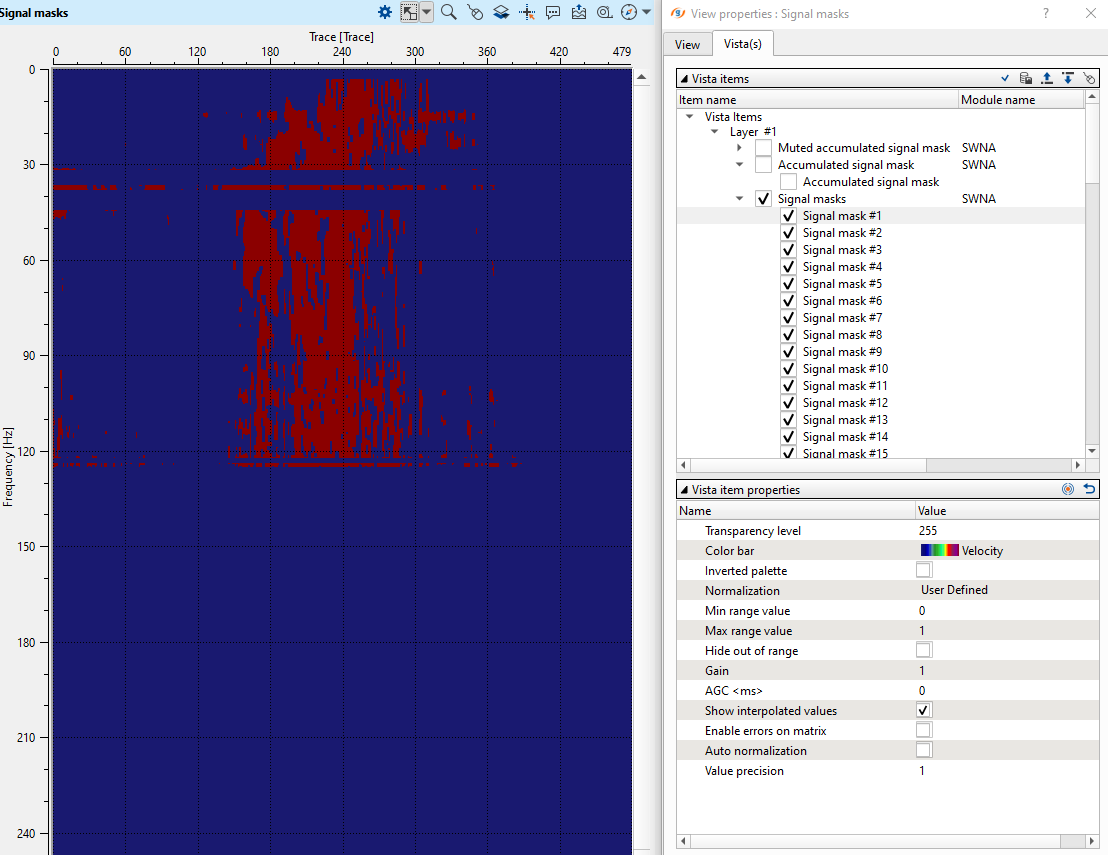
In the above image, Blue color represents the Signal (zero) and the red color represents the noise (non-zero). In case the Signal masks display is white, please check the Normalization as "User defined" and change the min and max range value from 0 to 1.
Window step (ms)
The step size of the window to move down. In case the start window starts at 0ms with a Time window of 500ms then the calculation window is 0ms - 500ms. Now with the window step of 50ms, the next calculation window will be 50ms-550ms. This will continue till it reaches the last sample of the input data.
Minimum frequency
Define the minimum frequency to be included in the frequency spectral computation.
Maximum frequency
Define the maximum frequency
Nose detection probability threshold %
From the T-X domain to F-X domain, each sample in F-X domain is determined whether it is noise or signal by the means of this noise detection threshold parameter.
Noise selection threshold %
Frequency spectrum is calculated from both signal and noise. After that we attenuate/mute the noise from the accumulated signal mask by the defined noise select threshold %.
Noise attenuation method:
Scaling down:
For the whole gather, we calculate the frequency spectrum and for each frequency we calculate the mean(average) amplitude of the signal as well as the noise. Then we scale down the noise to make it mean amplitude equal to mean amplitude of the signal.
PDF estimation:
These parameters are used to detect the noise. In this, we try to estimate the exponential probability distribution of both signal and noise.
Number of iteration
Define the total number of iterations to perform the Probability Distribution Function(PDF) to estimate and differentiate the mean amplitudes of both signal and noise in an iterative process.
Tolerance
Define the tolerance. For each frequency, we calculate the mean amplitude of the signal and noise and compare the mean amplitudes of the current iteration and the previous iterations of both signal and noise together. When the difference between the signal and noise mean amplitudes are equal or close to the defined tolerance value the process stops.
5) Save seismic by gather is used to save the seismic data in g-Platform’s internal format with .gsd extension. This module should be used within the Seismic Loop.