Improving seismic resolution by Gabor Deconvolution
![]()
![]()
Gabor deconvolution is used when the seismic wavelet is not stable. In case of the Wiener deconvolution, it works on the stable or stationary (where frequency won't changes with the time in the Fourier transformation) wavelets and it may not work well with the attenuation. In contrast, Gabor deconvolution works with the non-stationary wavelets with the consideration of the attenuation. It is a time-frequency domain method that uses the Gabor transformation to analyze the data in both time and frequency domains.
Gabor transform decomposes the seismic signal into frequency constituents and its variations over the time. It is performed by applying the Gaussian window to the seismic signal and computing the Fourier transformation of the windowed signal. Generally, we use the Gaussian half window to analyze the seismic signal locally in time.
Gabor transformation of a seismic signal can be written as
Where
•s(t) - Input seismic signal at time t
•g(t-t') - Gaussian window centered at time t'
•f - frequency
•t' - time shift
How does Gabor transformation works?
1.Select the desired Gaussian window (half window) for better time and frequency resolution
2.Apply the Gaussian window by multiplying the signal s(t) with the Gaussian window g(t-t') centered at time t'.
3.Computed the Fourier transformation of the windowed signal. This gives frequency content at time t'.
4.Shift the window along the time axis to get the time-frequency representation. Repeat this for all time shifts.
In Gabor deconvolution, seismic trace is represented by time - frequency domain. Deconvolution is performed by multiplying the Gabor transformation of seismic signal by Gabor transformation of seismic wavelet.
Where:
• - Gabor transform of the seismic signal
• - Gabor transform of the seismic wavelet
• - Estimated reflectivity in time-frequency domain
Final reflectivity series is obtained by applying inverse Gabor transform to
How does Gabor Deconvolution works?
1.Compute the Gabor transform of the seismic signal
2.Estimate the seismic wavelet first and compute the Gabor transform of the wavelet
3.Divide the Gabor transform of seismic signal by Gabor transform of wavelet. This gives the estimated reflectivity.
4.Apply the inverse Gabor transform to the estimated reflectivity to get the final reflectivity series.
![]()
![]()
Input DataItem
Input gather - connect/reference to the output gather. In case it is inside the Seismic loop module, it will automatically connect/reference to the previous modules output gather.
Connect this input to the seismic gather on which Gabor deconvolution will be applied. The input should contain pre-stack or post-stack seismic traces in the time domain. When the module is placed inside a Seismic Loop, it automatically connects to the previous module's output gather. The deconvolution is applied independently to each trace in the gather.
![]()
![]()
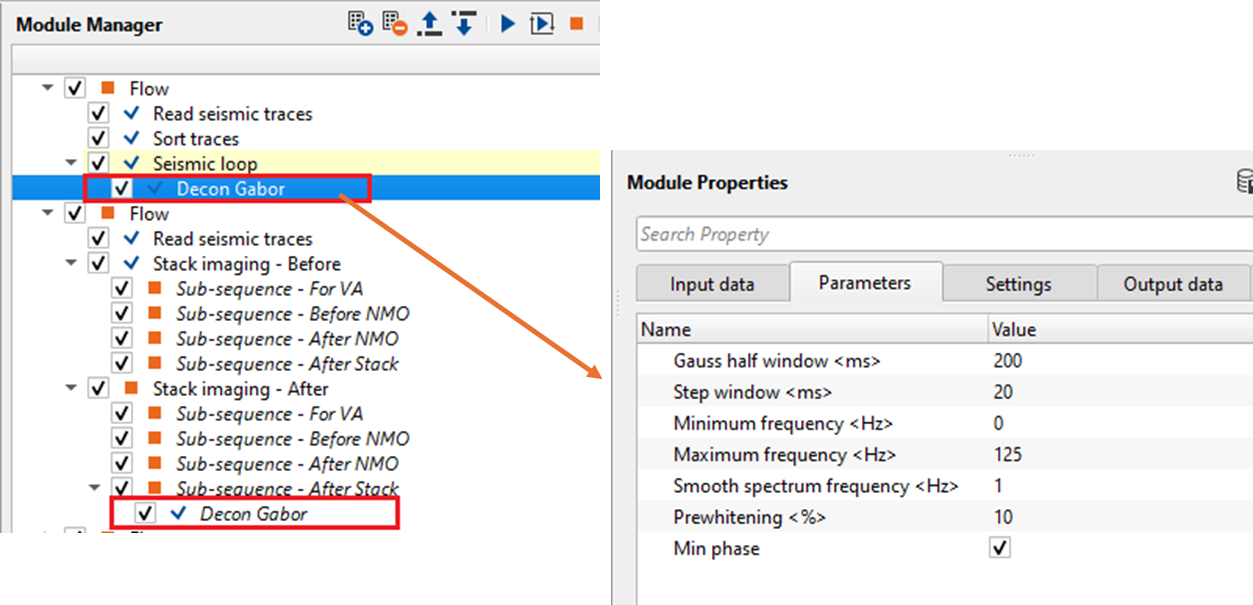
Gauss half window - It is a one sided window that is used for localizing time-frequency analysis. In the Gabor transformation, Gaussian half window is used to analyze a signal locally in time.
This parameter controls the half-length (in seconds) of the Gaussian taper applied to each segment of the seismic trace before the Fourier transform is computed. A larger half window captures more time context for each frequency estimate, resulting in better frequency resolution but reduced time resolution. A smaller value gives sharper time localization at the cost of frequency resolution. The default value is 0.1 s, with a minimum of 0.008 s. For typical seismic data with dominant frequencies of 30–80 Hz, a value in the range of 0.05–0.15 s is appropriate. Increase this value when the data has low dominant frequency content; decrease it to better track rapidly varying attenuation effects.
Step window - specify the time window to perform the Gabor transformation within the user specified step size. This will determines how much the window should be shifted along the time axis to perform the Gabor transformation.
This parameter defines how far (in seconds) the Gaussian analysis window is shifted along the trace between successive Gabor transform computations. A smaller step produces a finer, more densely sampled time-frequency representation and smoother deconvolution results, but increases computation time proportionally. A larger step speeds up processing at the cost of time resolution in the deconvolution filter. The default value is 0.01 s, with a minimum of 0.002 s. The step should be small enough relative to the Gauss half window so that adjacent windows overlap significantly, ensuring smooth reconstruction. As a practical guideline, set the step to no more than half the Gauss half window value.
Minimum frequency - specify the minimum/lowest frequency used in the Gabor transformation.
Set this to the lower bound of the usable frequency band in your seismic data (in Hz). The Gabor deconvolution filter is applied only within the frequency range defined by the minimum and maximum frequency parameters. Energy below this frequency is excluded from the deconvolution calculation, which helps avoid amplifying very low-frequency noise or DC bias. The default value is 0 Hz. For most land and marine seismic data, a value of 5–10 Hz is a reasonable starting point to exclude low-frequency noise.
Maximum frequency - specify the maximum/highest frequency used in the Gabor transformation.
Set this to the upper bound of the usable frequency band in your seismic data (in Hz). Frequencies above this value are excluded from the deconvolution process, which avoids boosting high-frequency noise beyond the meaningful signal bandwidth. The default value is 125 Hz. In practice, set this value based on the Nyquist frequency of your data and the actual signal bandwidth observed in the amplitude spectrum. Setting it too high may amplify noise in the high-frequency band; setting it too low may limit the resolution benefit of the deconvolution.
Smooth spectrum frequency - specify the frequency value to smooth the spectrum of the amplitude of the seismic trace.
This parameter controls the frequency bandwidth (in Hz) over which the amplitude spectrum at each time-frequency position is smoothed before constructing the deconvolution operator. Smoothing the spectrum suppresses random spectral variations caused by noise and reflectivity, helping the algorithm estimate a smoother, more stable wavelet. A larger value applies stronger smoothing, producing a gentler deconvolution filter. A smaller value preserves more spectral detail but may make the filter less stable in the presence of noise. The default value is 1 Hz. Values in the range of 1–10 Hz are typical. If the output shows spectral artefacts or frequency-domain ringing, try increasing this value.
Prewhitening - specify the % white noise added to the data to stabilize the deconvolution process.
Prewhitening adds a small percentage of white noise to the amplitude spectrum of the estimated wavelet before inverting it to form the deconvolution operator. This prevents division by near-zero values at frequency notches, stabilizing the solution and avoiding numerical instability. The value is expressed as a percentage of the maximum spectral amplitude. The default value is 0.1%. Note that in Gabor deconvolution, the prewhitening level is typically set higher than in conventional Wiener (spiking) deconvolution — values in the range of 1–10% are commonly used. A higher prewhitening value produces a more stable but less aggressive deconvolution; a lower value increases resolution potential at the risk of boosting noise. Adjust this value during testing and inspect the output spectrum to find the optimal balance for your data.
Min phase - By default, TRUE (Checked). Deconvolution expects the input data in minimum phase (the reason being is that the seismic source generates the energy and the seismic wavelet gets it's maximum energy/peak at the beginning and it gradually decreases. So, it is easier for the deconvolution operator to work on the minimum phase wavelet).
When enabled (the default), the module internally converts the estimated wavelet to its minimum-phase equivalent before performing deconvolution. This is appropriate when the input data contains a minimum-phase wavelet, which is typical for land seismic data acquired with dynamite sources and for marine data that has not been zero-phased. The minimum-phase assumption allows the deconvolution filter to be both causal and stable, which is critical for reliable results. Disable this option only if the input data already contains a zero-phase or mixed-phase wavelet and you have verified that the phase content of your data does not meet the minimum-phase assumption.
![]()
![]()
Auto-connection - By default, TRUE(Checked).It will automatically connects to the next module. To avoid auto-connect, the user should uncheck this option.
Bad data values option { Fix, Notify, Continue } - This is applicable whenever there is a bad value or NaN (Not a Number) in the data. By default, Notify. While testing, it is good to opt as Notify option. Once we understand the root cause of it, the user can either choose the option Fix or Continue. In this way, the job won't stop/fail during the production.
Notify - It will notify the issue if there are any bad values or NaN. This is halt the workflow execution.
Fix - It will fix the bad values and continue executing the workflow.
Continue - This option will continue the execution of the workflow however if there are any bad values or NaN, it won't fix it.
Calculate difference - This option creates the difference display gather between input and output gathers. By default Unchecked. To create a difference, check the option.
Number of threads - One less than total no of nodes/threads to execute a job in multi-thread mode. Limit number of threads on main machine.
Skip - By default, FALSE(Unchecked). This option helps to bypass the module from the workflow.
![]()
![]()
Output DataItem
Output gather - generates Gabon deconvolution filter applied deconvolution output gather.
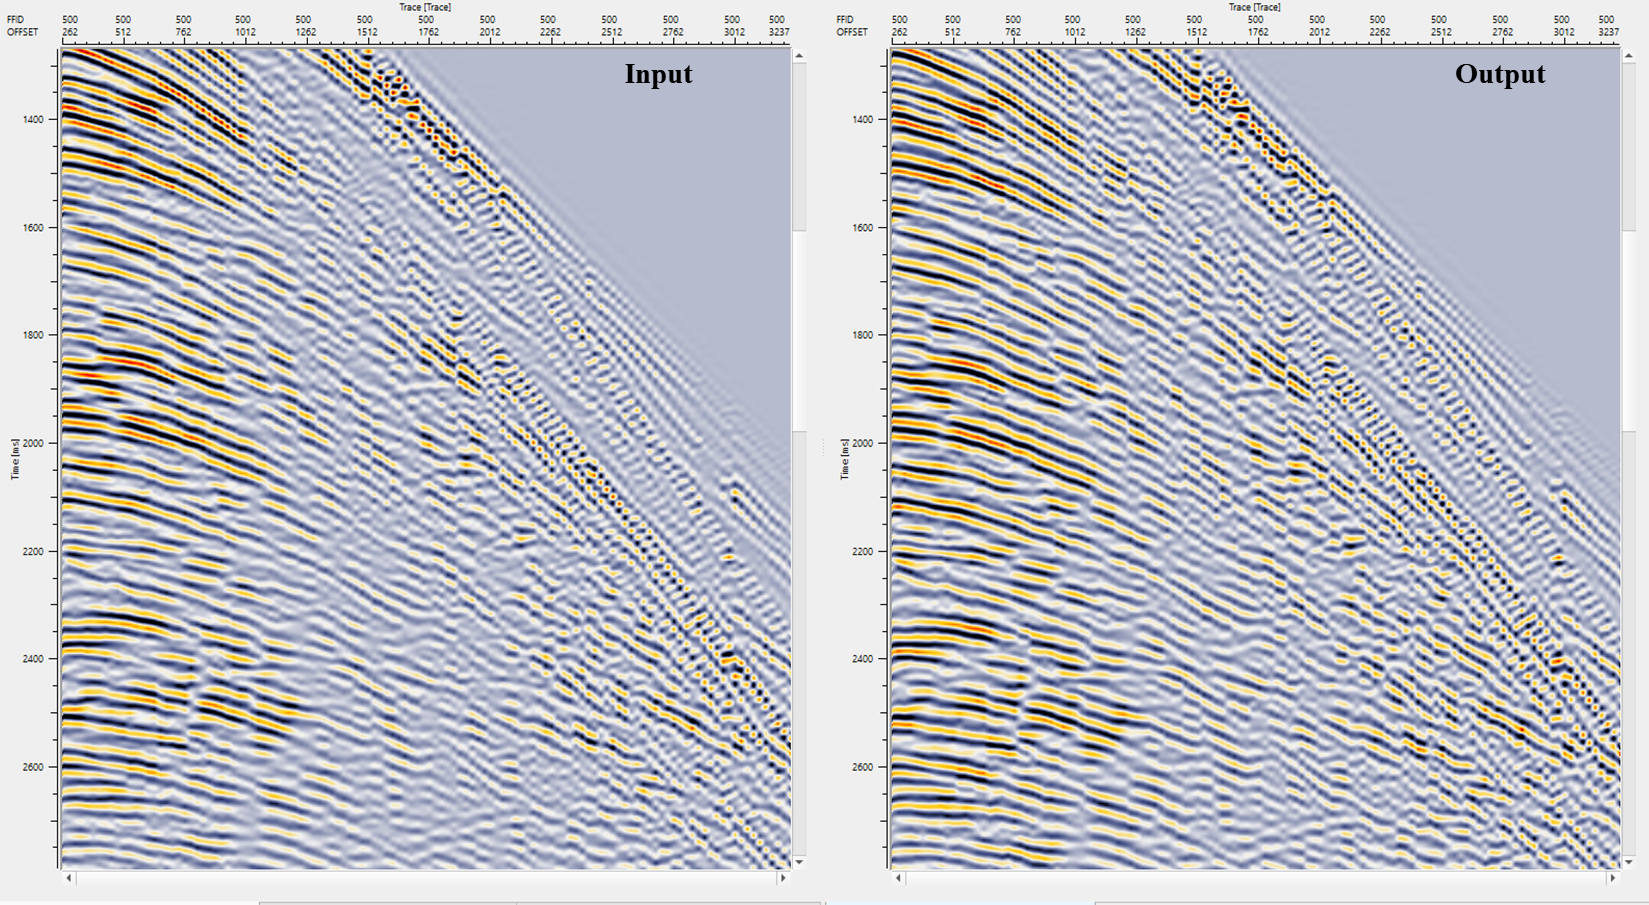
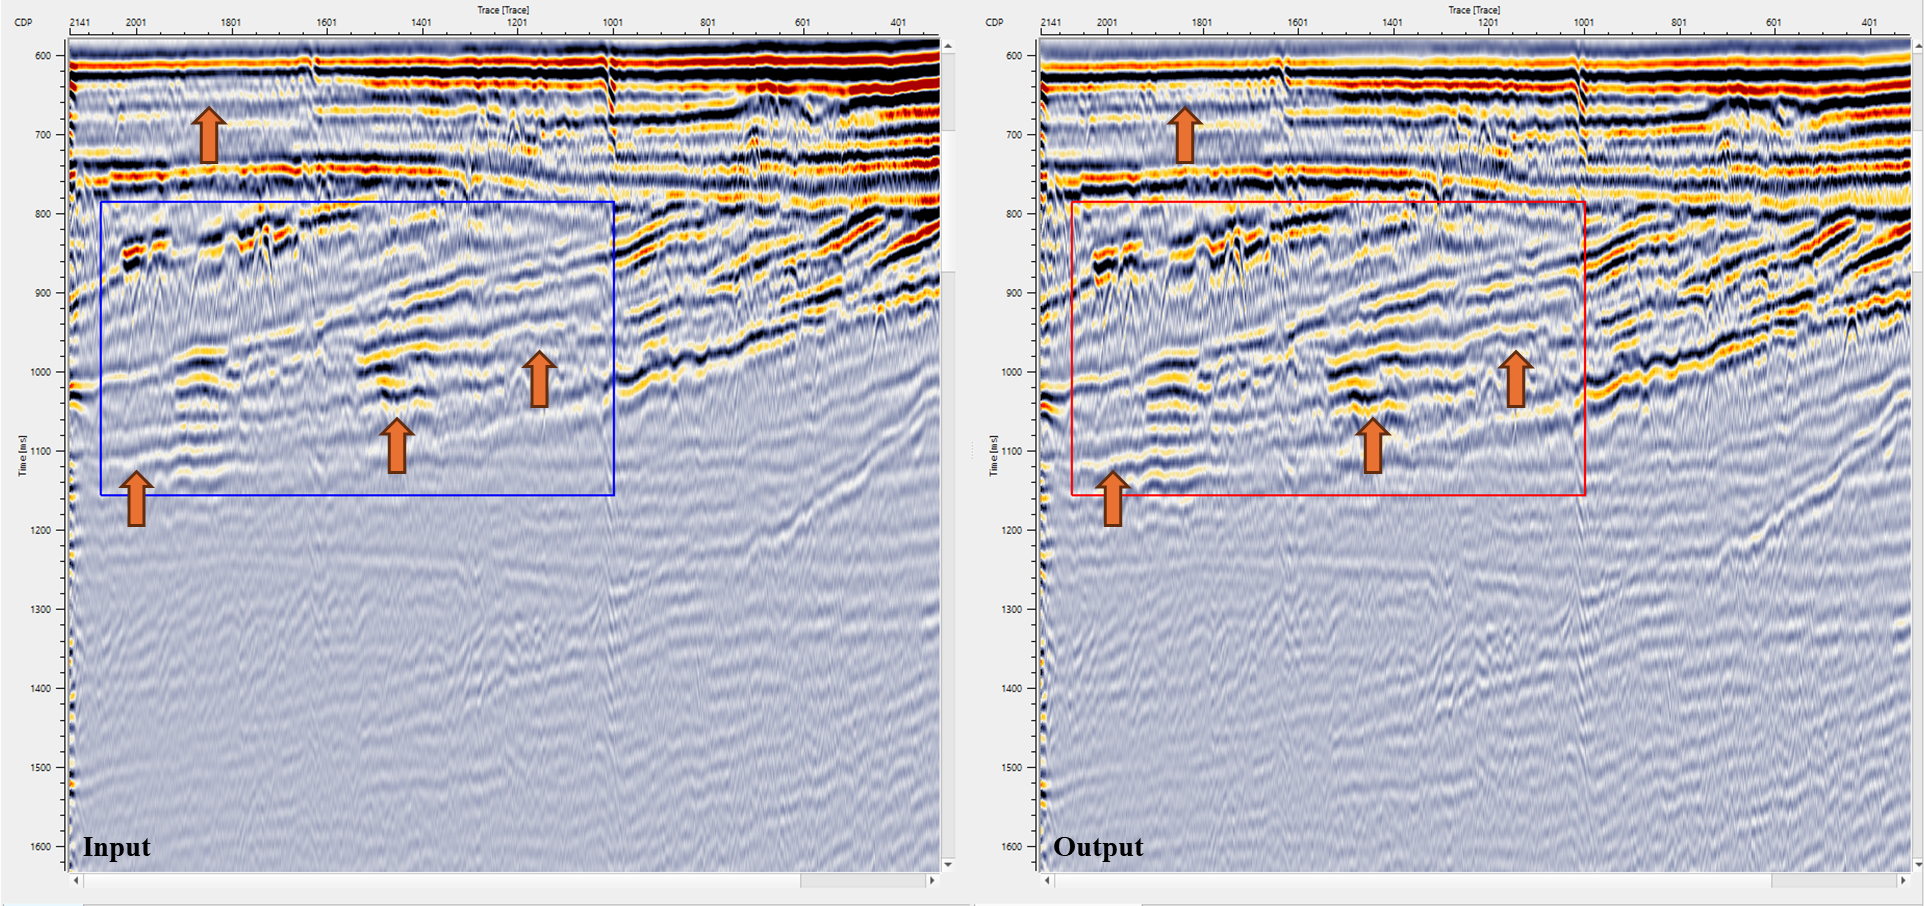
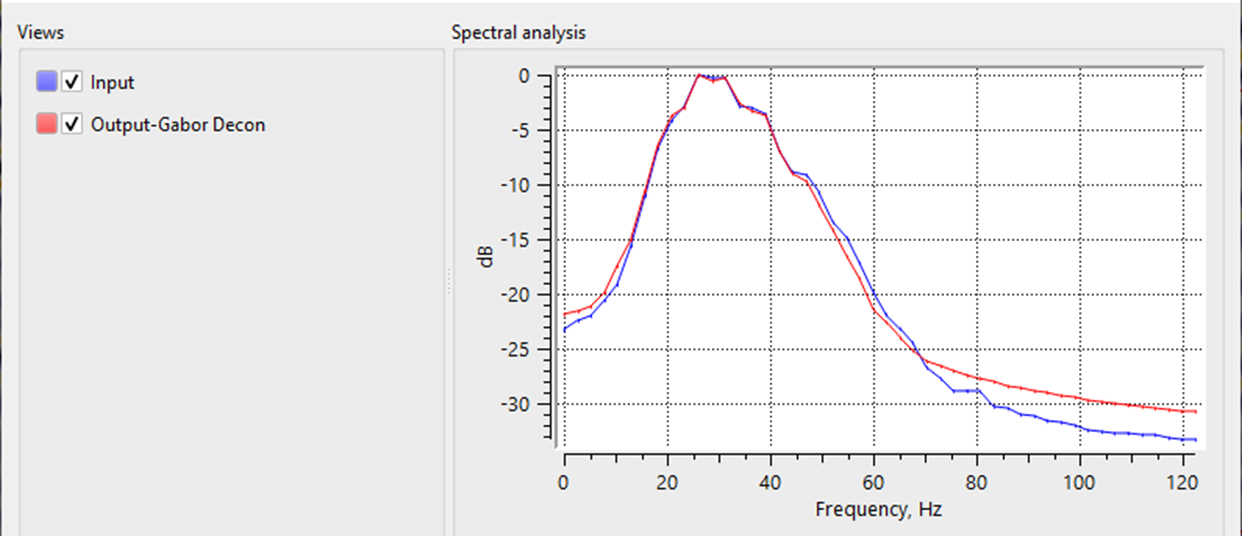
This is the primary result of the module. It contains the deconvolved seismic traces, in which the non-stationary wavelet has been compressed by applying the Gabor deconvolution filter in the time-frequency domain. Each output trace has the same number of samples and the same time range as the corresponding input trace. The output gather can be connected to the next processing module in the workflow or saved to disk for further analysis. Compared to the input, the output should display improved temporal resolution with sharper reflector boundaries, while the overall amplitude spectrum is flattened within the specified frequency band.
Gather of difference - generates the difference display gather between input and output gathers.
This diagnostic output contains the trace-by-trace amplitude difference between the input gather and the deconvolved output gather. It is available only when the Calculate difference option is enabled in the Settings section. Viewing this difference gather is useful for quality control: it shows what has been removed from the data by the deconvolution process. A difference gather that contains primarily coherent signal — rather than random noise — may indicate that the deconvolution operator is over-aggressive and is removing useful energy. Conversely, a difference gather dominated by noise confirms that the operator is well-tuned.
There is no information available for this module so the user can ignore it.
![]()
![]()
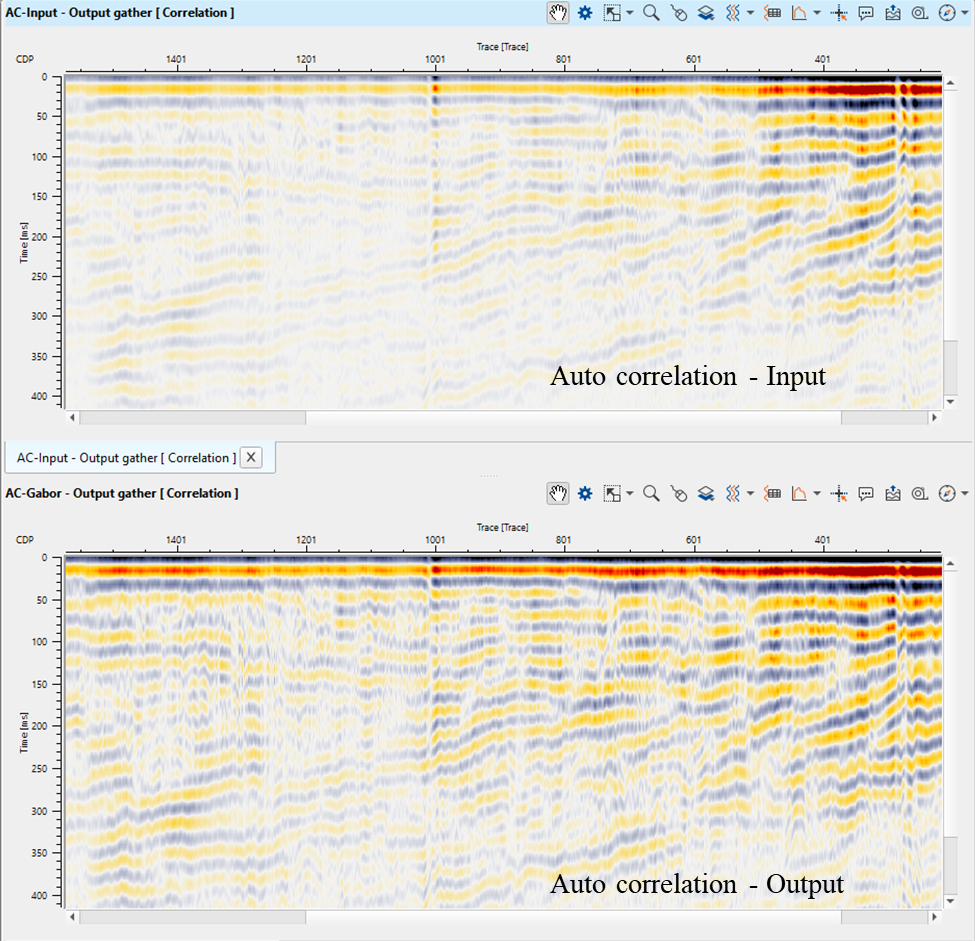
In this example workflow, we are using Gabor Deconvolution to improve the resolution of the seismic traces.
During the parameter testing, look into the Prewhitening % values. Unlike the Decon Wiener where the % while noise added to the seismic trace in Decon Gabor is on the higher side.
![]()
![]()
There are no action items available for this module so the user can ignore it.
![]()
![]()
YouTube video lesson, click here to open [VIDEO IN PROCESS...]
![]()
![]()
Yilmaz. O., 1987, Seismic data processing: Society of Exploration Geophysicist
 * * * If you have any questions, please send an e-mail to: support@geomage.com * * *
![]()