Boosting amplitudes using Time variant scalars
![]()
![]()
It is used to balance the amplitudes of the seismic traces with varying time. As we know that the seismic data loses its energy due to spherical divergence, absorption etc. Higher frequencies get lost as they travel longer and deeper. To balance the amplitudes, we use RMS & Mean methods.
How do we calculate the Amplitude scalars?
•Divide the seismic trace into user defined time windows.
•Calculate the amplitudes by using RMS & Mean (Average) within each window.
•Scaling each window to balance the amplitudes. This is done window by window thus creating a smooth time-variant scaling function without creating any footprints.
Measured Amplitude can be either RMS or Mean (Average) amplitude values.
RMS Amplitude can calculated using the formula
Mean Amplitude is calculated using the formula
Where
N - Number of samples in the time window
x - Amplitude of the sample in the time window
RMS is popular when there is a huge difference between shallow and deeper parts as the deeper parts require more balanced amplitudes. RMS boosts the lower amplitudes better than the Mean, however, Mean is good for less aggressive and smooth application of amplitude scalars.
![]()
![]()
Input DataItem
Input gather - connect/reference to output gather. If it is inside the Seismic loop module, then it automatically takes the previous modules output gather as an input to this module.
![]()
![]()
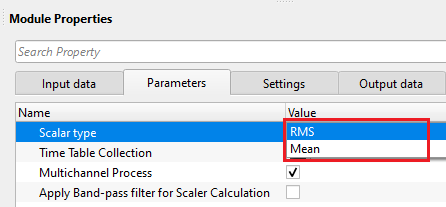
Scalar type - this process calculates the scalar values and apply to the data. These scalar values are calculated by two methods. Choose one of them from the drop down menu.
RMS - Root Mean Square calculates the amplitudes within the user defined time window. It is very sensitive to higher amplitude values.
Mean - Average or Mean calculates the amplitudes within the user defined time window and it is less sensitive to higher amplitude values.
Time Table Collection - define time windows for the scalar. Each entry in the table will contain:
The Start time of the window (Time start <ms>)
End time of the window (Time End <ms>)
The time at which the scalar is referenced (Reference Time <ms>)
Desired level of scaling for data within that window (Desired output)
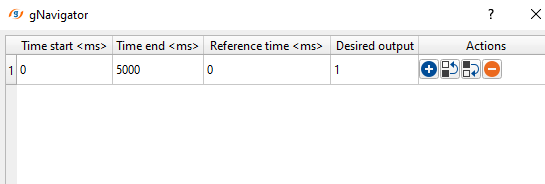
Additional entries in the table are added by pressing the (+) button, and removed by pressing the (-) button, and re-arranged using the up and down arrows.
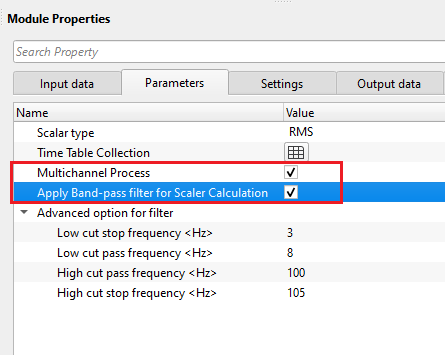
Multichannel Process - check this box to have the module run as a multichannel process
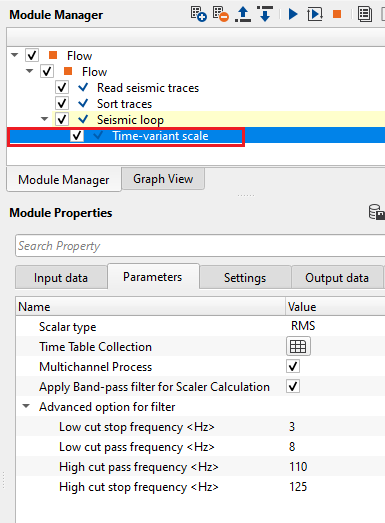
Apply Band-pass filter for Scaler Calculation - check this box to apply a band pass filter in addition to the Time Varian scale. Set the parameters for the filter in the “Advanced option for filter” section
Advanced option for filter - filter options to apply the band pass filters.
Low cut stop frequency - Cut off frequency on the low frequency end
Low cut pass frequency - Pass frequency for the filter at the low end
High cut pass frequency - Pass frequency for the filter at the high end
High cut stop frequency - Cut off frequency at the high frequency end
![]()
![]()
Auto-connection - By default, TRUE(Checked).It will automatically connects to the next module. To avoid auto-connect, the user should uncheck this option.
Bad data values option { Fix, Notify, Continue } - This is applicable whenever there is a bad value or NaN (Not a Number) in the data. By default, Notify. While testing, it is good to opt as Notify option. Once we understand the root cause of it, the user can either choose the option Fix or Continue. In this way, the job won't stop/fail during the production.
Notify - It will notify the issue if there are any bad values or NaN. This will halt the workflow execution.
Fix - It will fix the bad values and continue executing the workflow.
Continue - This option will continue the execution of the workflow however if there are any bad values or NaN, it won't fix it.
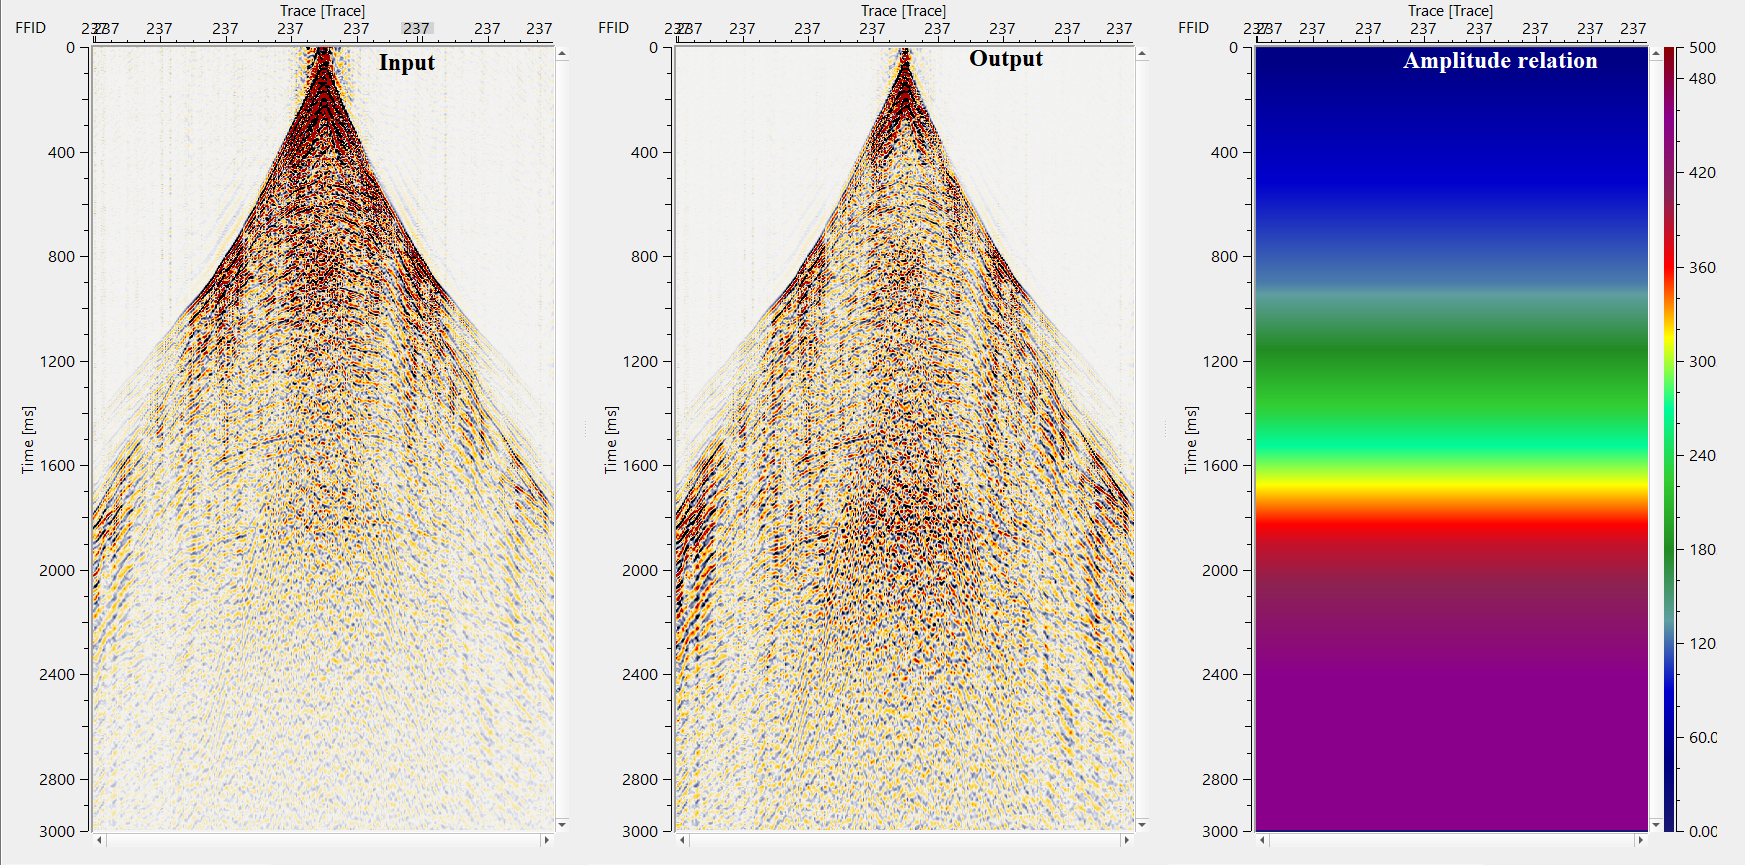
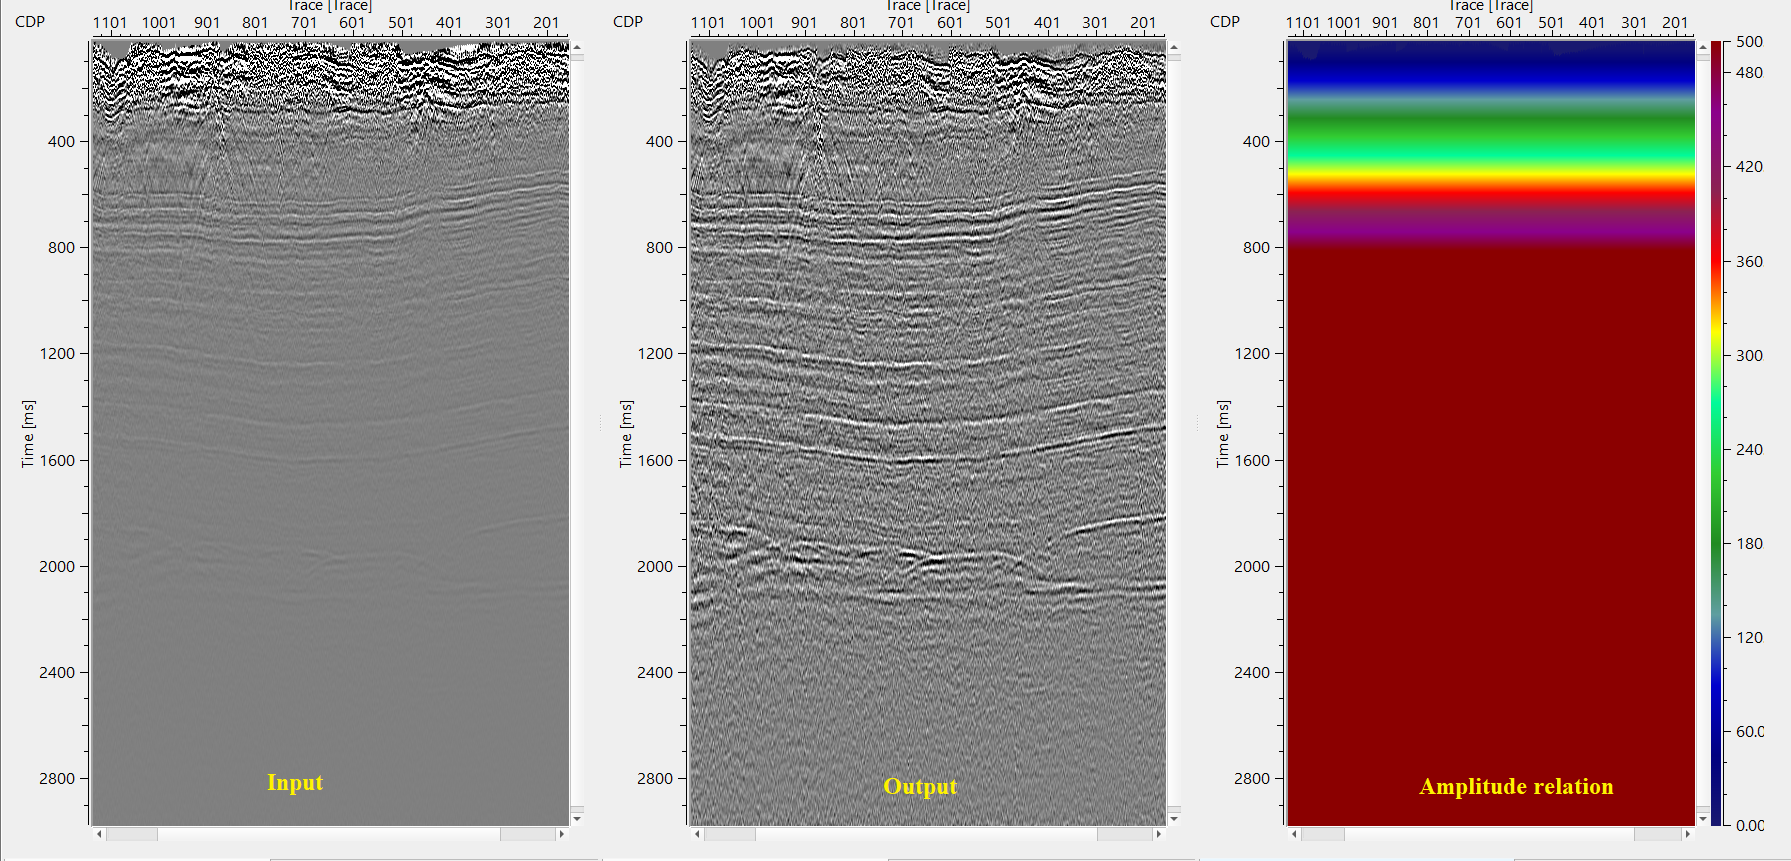
Calculate relation - This option creates the difference display gather between input and output gathers. By default Unchecked. To create a difference, check the option.
Number of threads - One less than total no of nodes/threads to execute a job in multi-thread mode. Limit number of threads on main machine.
Skip - By default, FALSE(Unchecked). This option helps to bypass the module from the workflow.
![]()
![]()
Output DataItem
Output gather - generates the final output gather after application of time variant scalars.
Amplitude relation - outputs the amplitude relationship.
There is no information available for this module so the user can ignore it.
![]()
![]()
In this example workflow, we apply time-variant scaling on a common shot gather. As we described above in the theory part that, it calculates the scaling factors in a given window and apply these scalars to the seismic trace. The scalar factor is calculated either RMS or Mean method.
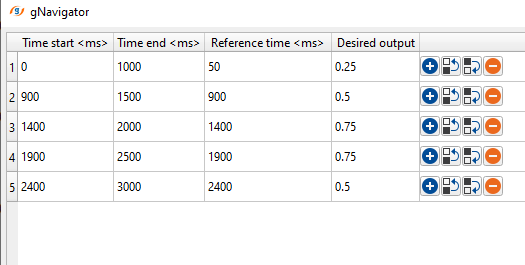
Based on the reference time and desired output value, it calculates the scalar factor by using the formula target amplitude/measured amplitude using scalar calculation method of RMS or Mean. In the above example, the user desired an output of 0.25 from 0 to 1000 ms with a reference time at 50 ms. It calculates the scalar and extrapolate the values between 0 to 1000 ms with reference time of 50 ms. Likewise, it calculates the scaling factors for other time windows.
![]()
![]()
There are no action items available for this module so the user can ignore it.
![]()
![]()
YouTube video lesson, click here to open [VIDEO IN PROCESS...]
![]()
![]()
Yilmaz. O., 1987, Seismic data processing: Society of Exploration Geophysicist
 * * * If you have any questions, please send an e-mail to: support@geomage.com * * *