Displaying/viewing the SEG-Y data
![]()
![]()
Quality Control of any process is the key step. During the seismic data acquisition, the data is acquired and recorded into the recording instrument. From there, it will transfer in to the processing systems. This data can be stored in various formats. Often times in SEG-Y format. Society of Exploration Geophysicists (SEG) standardized the data recording/storing format. There are various versions of the SEG-Y formats are developed over a period of type. This is the industry standard format for saving/recording the seismic data.
To view the seismic of the data, trace headers etc, we've View SEG-Y module in g-Platform. Within the View SEG-Y module, we can view the pre and post stack data. Also, edit/modify the EBCDIC/Text & Binary headers.
![]()
![]()
Input data should be provided in the Parameters tab under File name. Because of that, the Input data tab is disabled for View SEG-Y module.
![]()
![]()
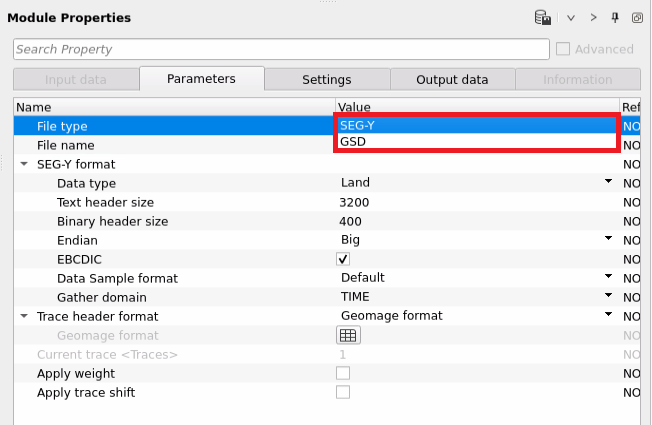
File type { SEG-Y, GSD } - There are two types of files can be chosen from the drop down menu.
SEG-Y - Standard SEG-Y format.
GSD - GSD(Geomage Standard Data) is an internal format.
File name - Provide the path to the SEG-Y file.
SEG-Y format -
Data Type - Select the appropriate data type. There are 3 data type options are available.
Land - Onshore data
Marine - Offshore data
Transition - Transition data where both onshore and offshore are transitioned.
Text header size - By default 3200. This is the standard text header size.
Binary header size - By default 400. This is also the standard binary header size.
Endian - Endian is a way of computer storing the data in the memory. There are two options available.
Big - In this option, the most significant byte of the data is stored in the smallest memory address and least significant byte is stored at the highest memory address.
Little - In this option, where the least significant byte of the data is stored in the smallest memory address.
EBCDIC - By default, Checked (Yes). If it is checked, it will display the EBCDIC or the text header of the SEG-Y data set. This information is very useful in understanding the details of the dataset. It comprises of processing history, survey details of the area/location, client information, Coordinate Reference System (CRS) information, Grid information etc.
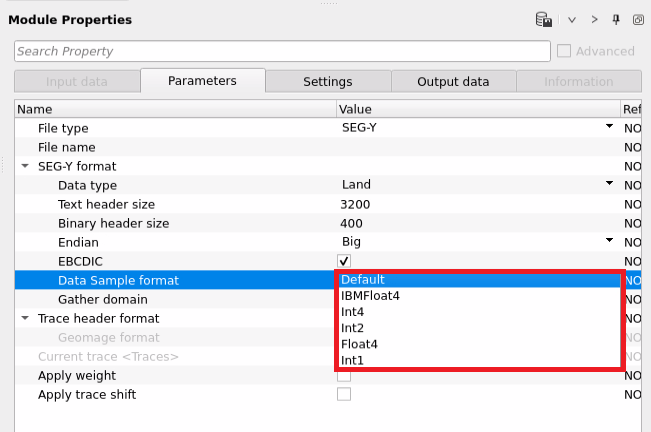
Data Sample format - This sample format tells us the in which format the data is acquired and recorded in the SEG-Y format. There are few standard formats. We've
IBMFloat4 - This is the standard IBM(International Business Machines) Floating point format where the data is recorded/stored in 32 bit floating format.
Int4 - This is a common computer storage format to store any integer data types. This is the integer format with 4 Bytes
Int2 - This is also the integer format with 2 Bytes. This is used as a compact storage to store any smaller integers.
Float4 - This is a IEEE(Institute of Electrical and Electronics Engineers) Floating point format with 4 Bytes (32 bit)
Int1 - This is Integer format with 1 Byte
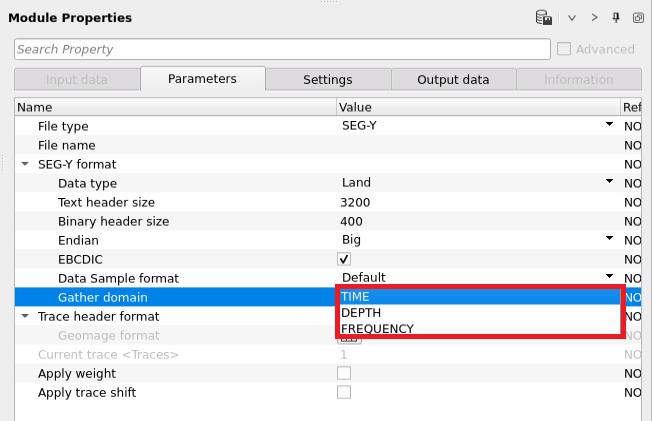
Gather domain - Choose the correct data domain. We've 3 options here
Time - When we've choose Time domain, the Y-axis will displays the time.
Depth - Whenever we've a Depth domain seismic gather/stack, choose this option. Y-Axis will be in Depth (meters)
Frequency - This is for any frequency domain data.
Trace header format { Geomage format, SegFormat, Seg-Y, rev.1, 2002, Geomage Office Post, Coordinates Only, Constant Elevation, VSP format, teapot_dome_3d, New format } - Choose the right trace header format to read the input data correctly. This is very crucial to accurately display the seismic data. By default, Geomage format which is a standard SEG-Y format.
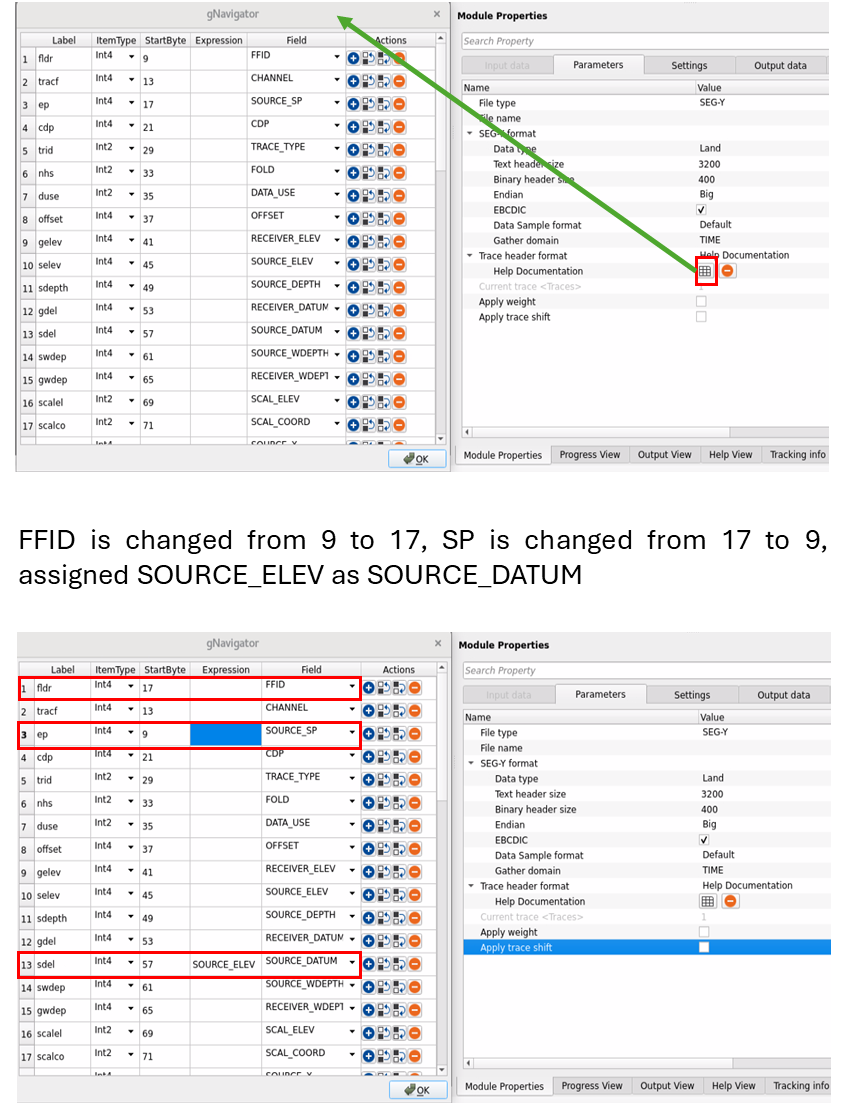
In case the user wants to create a new format which is non-standard SEG-Y format, they can select "New format" from the drop down menu. Give it a name and assign the trace headers values like byte location etc in the trace headers format.
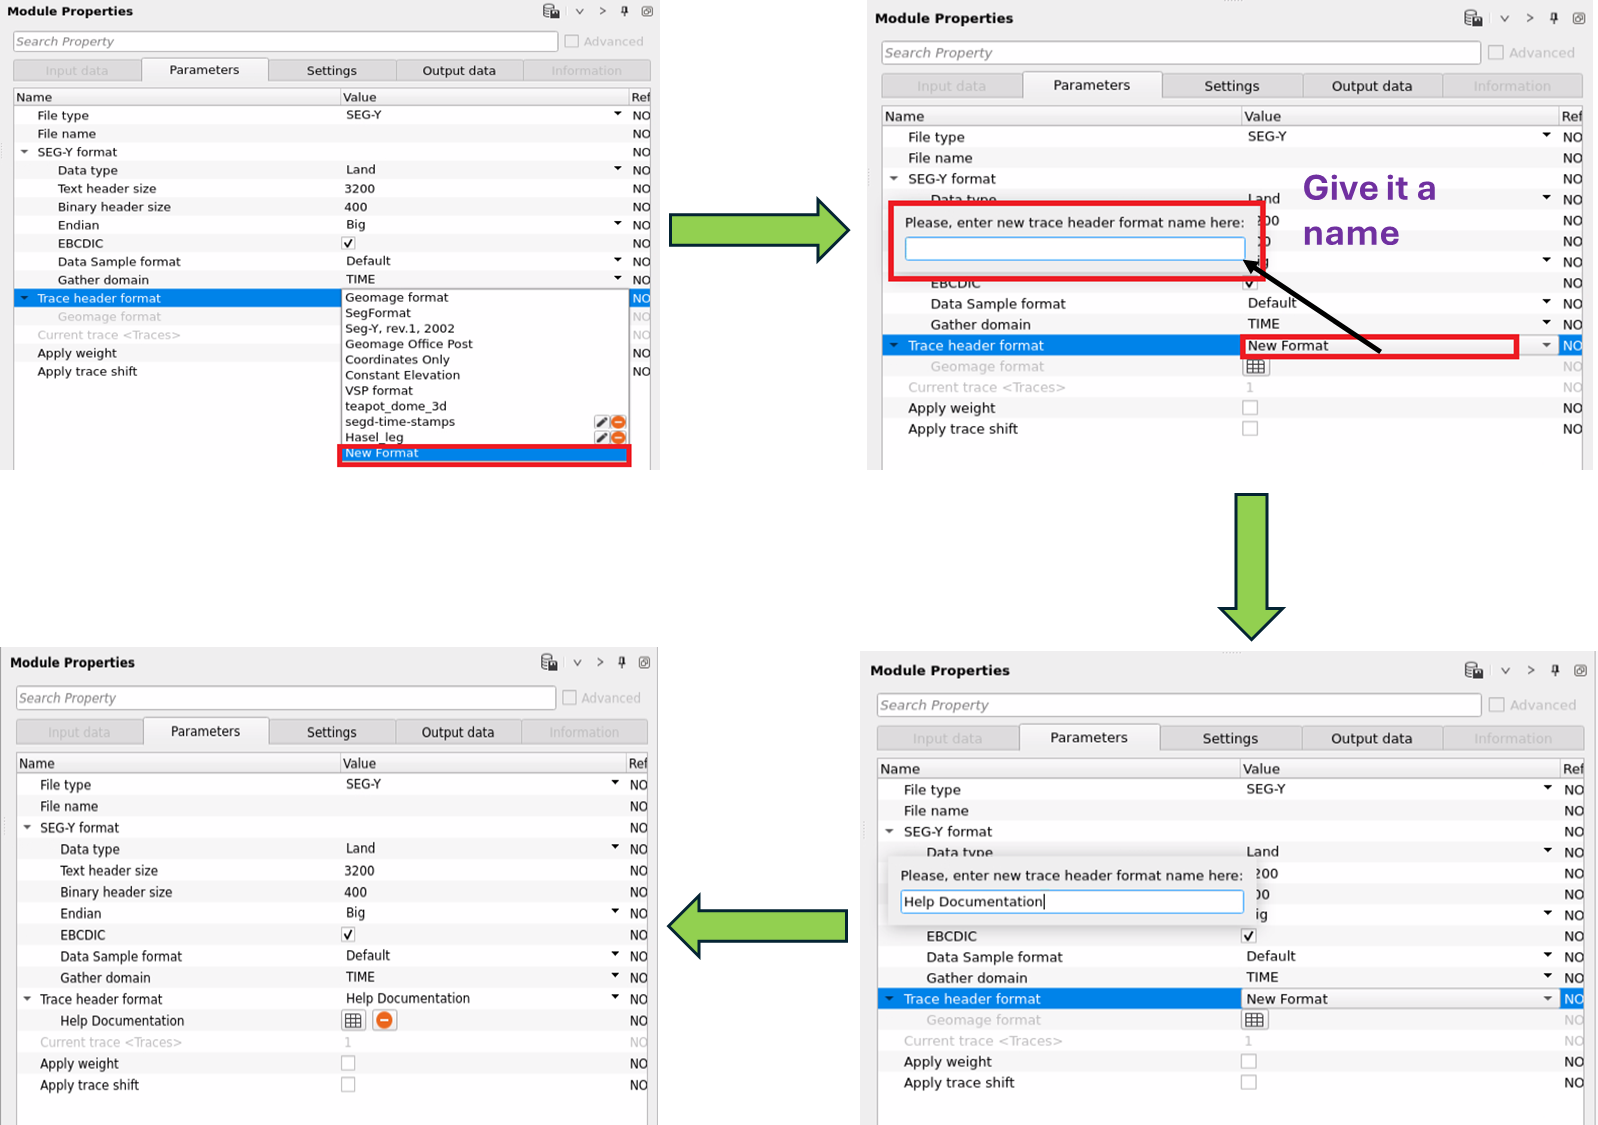
Now click on the Table symbol. It will open a new window with an empty trace header format. Here, the user can edit the trace headers. In this following example, we've changed the FFID byte location from 9 to 17, SOURCE_SP byte location from 17 to 9, SOURCE_ELEV as SOURCE_DATUM. This way the user can edit any non-standard SEG-Y trace headers format into a custom/new trace header format.
Current trace - By default, Checked (Yes). This will display the current trace location on the seismic gather/stack display
Apply weight -
Apply trace shift -
![]()
![]()
Number of threads - One less than total no of nodes/threads to execute a job in multi-thread mode.
Skip - By default, No (Unchecked). This option helps to bypass the module from the workflow.
![]()
![]()
SEG-Y data handle - Output SEG-Y data Item. This can be used to connect/reference to any other module
Text Header - It will output the updated EBCDIC/Text header
Binary Header - Updated Binary header is generated an output
Trace Header - Output trace headers. This can be used to reference/connect to any other modules for input trace headers.
![]()
![]()
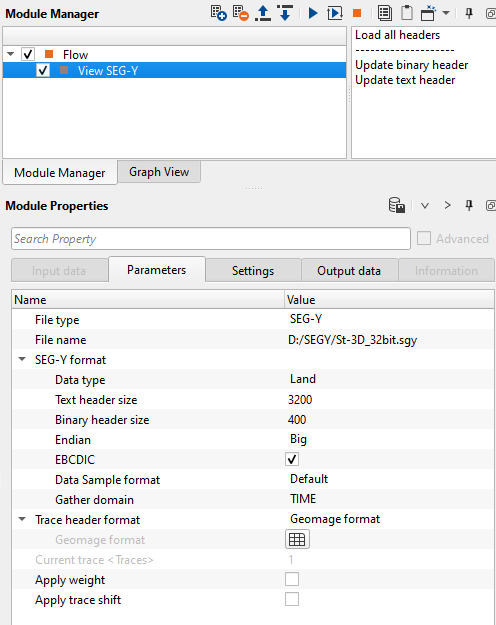
In the below example workflow, we are reading a 3D SEGY file using View SEG-Y module.
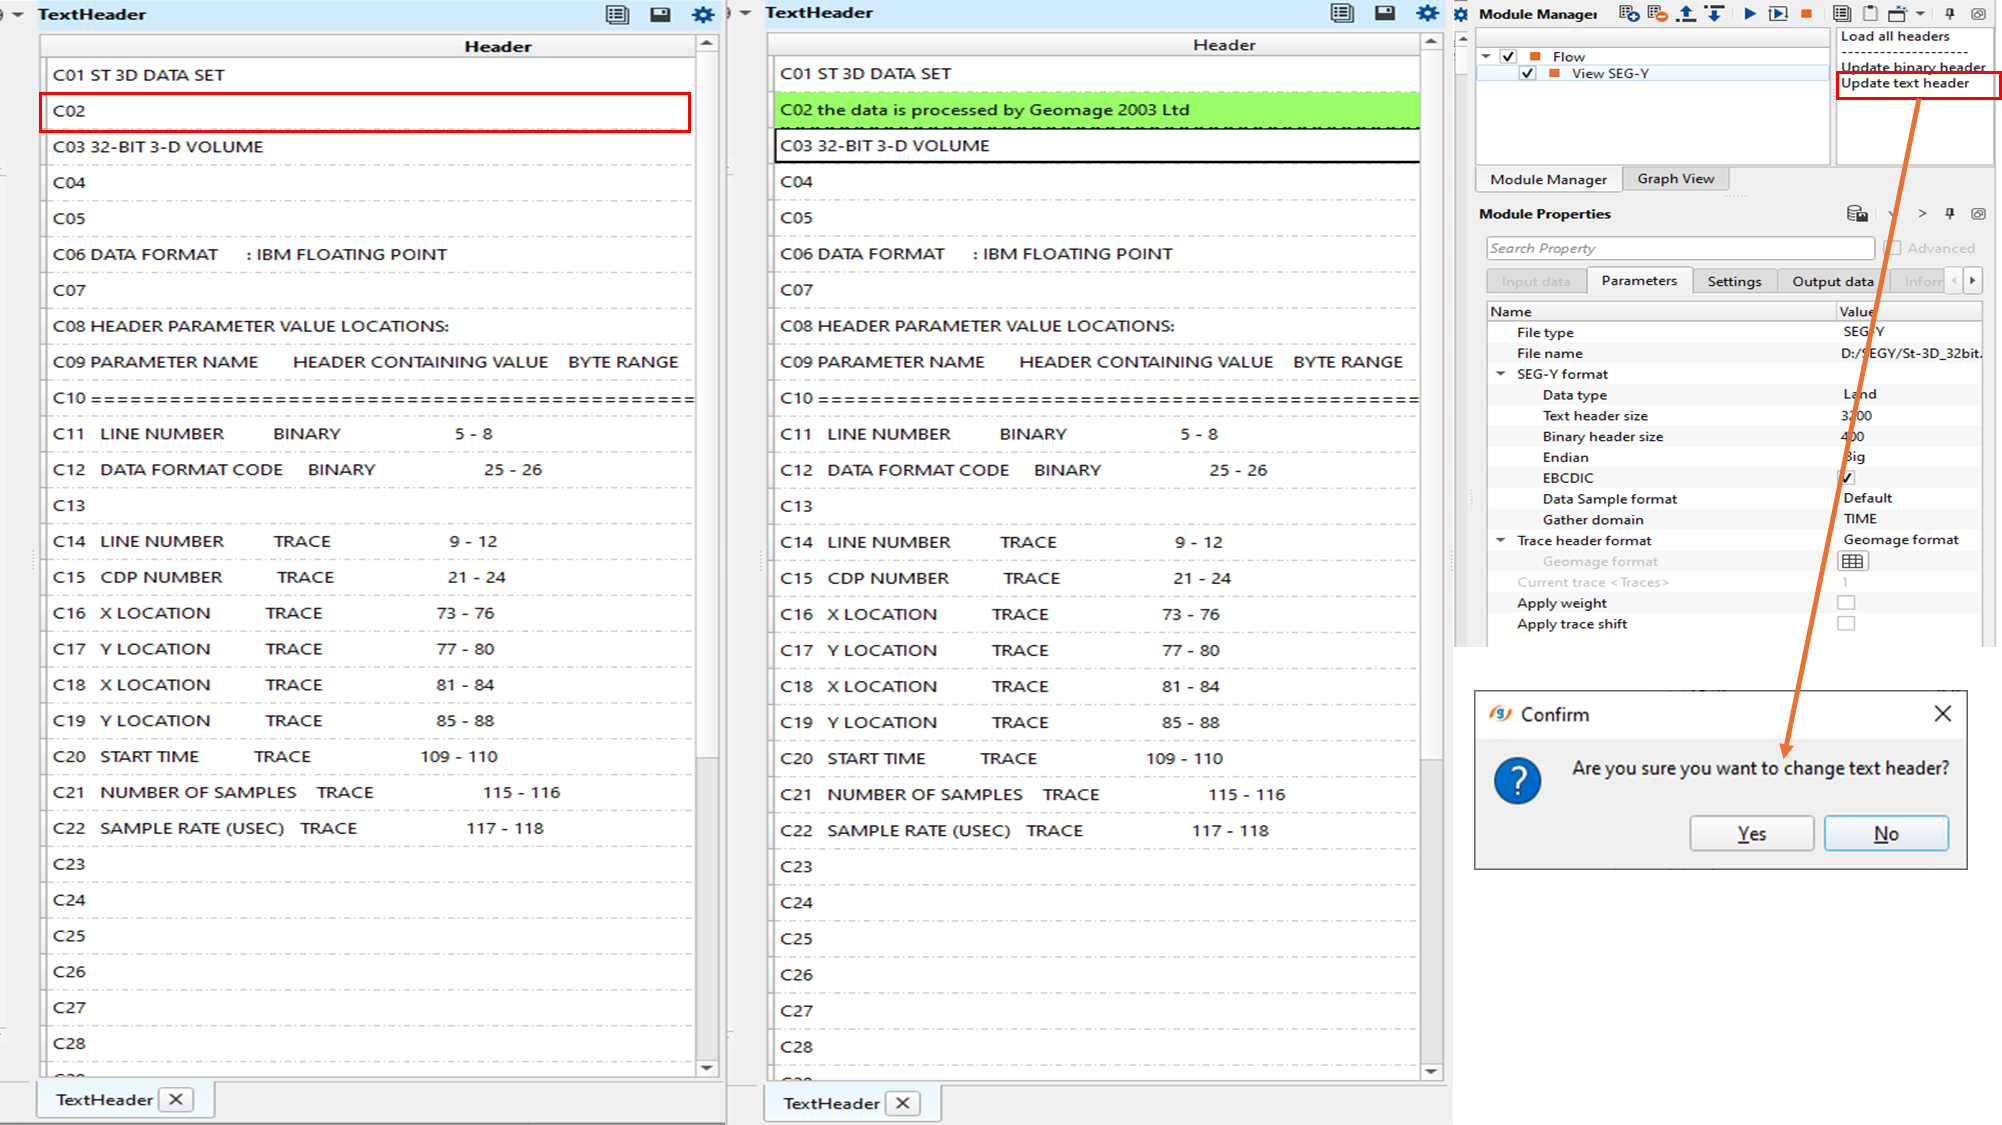
As a QC items, we'll have Text headers, Binary headers, Trace headers, QC Graph, Input and Location map. In the EBCDIC, if the user wants to change any of the text,double click inside the selected row and edit/change the text. Once the edits are made, the back ground will change from White to Green. To make the changes permanent, go to "Action items" and select "Update text headers". A new pop window will appear. Click Yes. Now it will show the updated changes in the Text headers window.
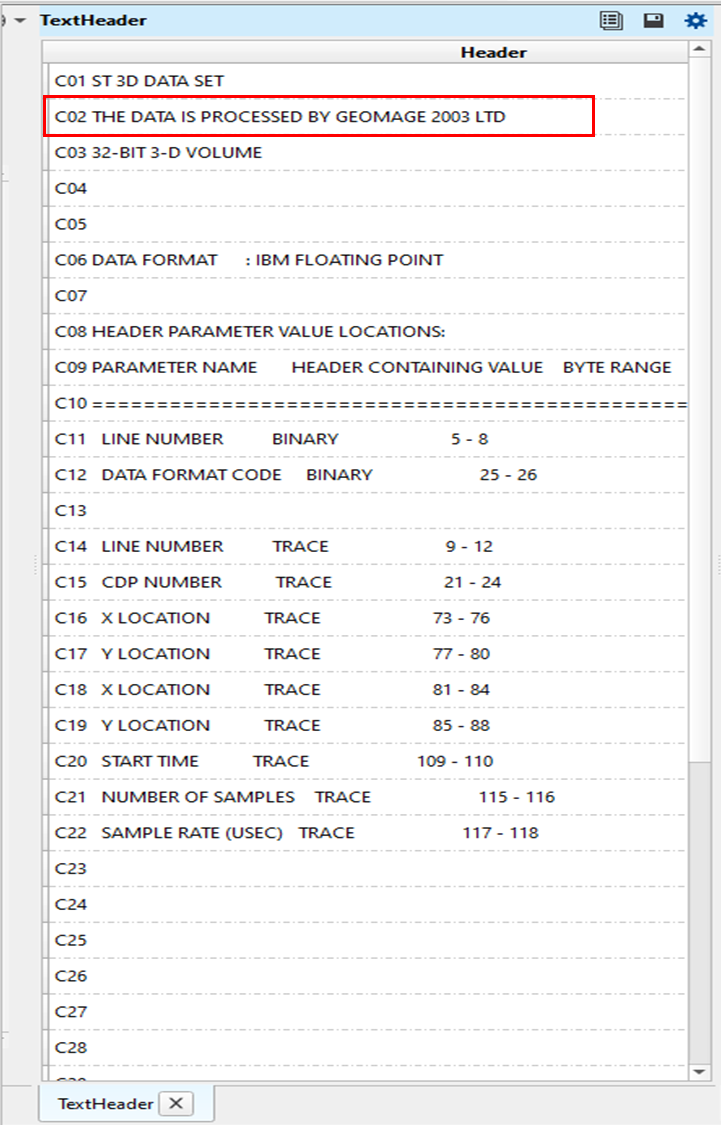
In this example, we would like to add some text into C02 which is currently empty. C02 is changed to "The data is processed by Geomage 2003 Ltd". After entering the text, the row's background color changed to Green. Now select the "Update text header". A pop-up window asks for confirmation. Click Yes and the changes will appear.
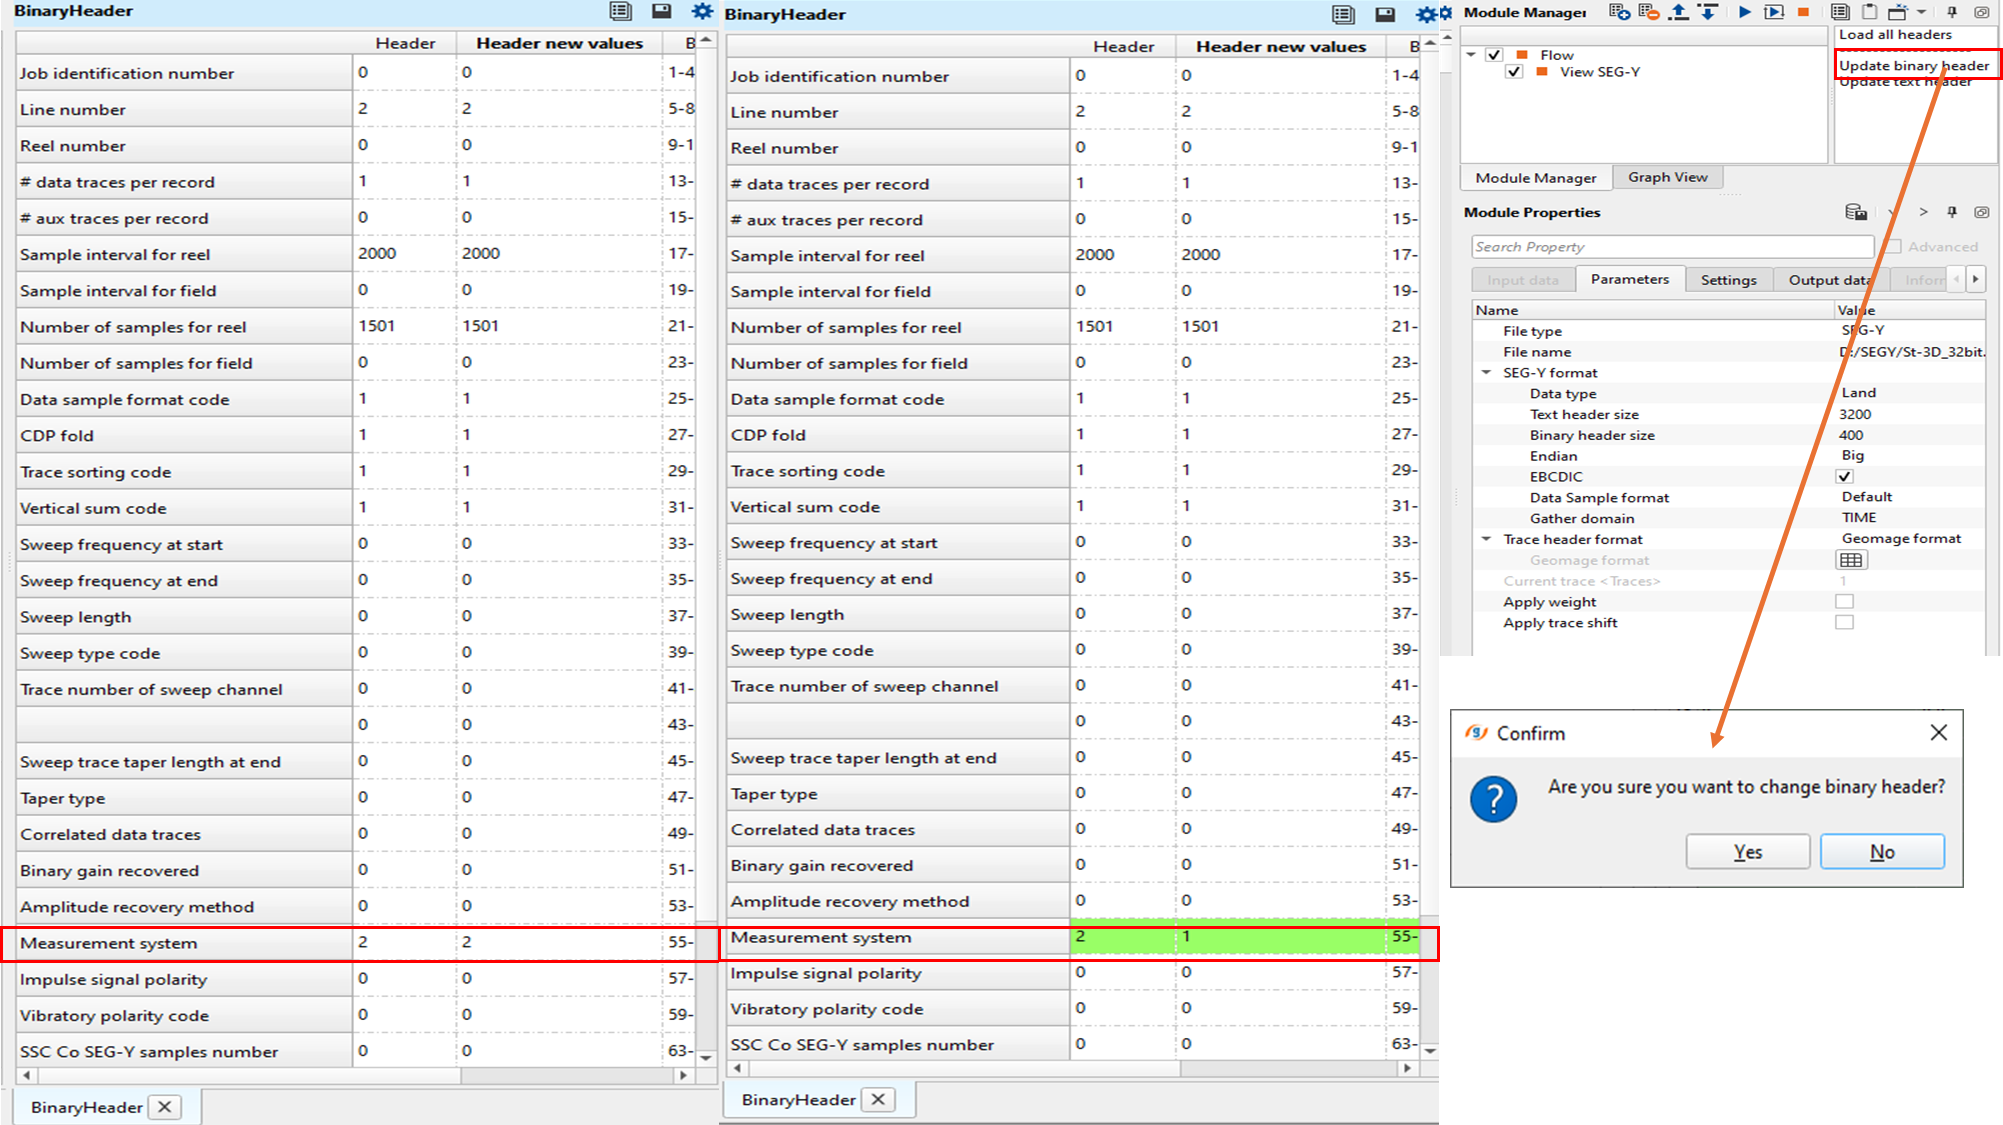
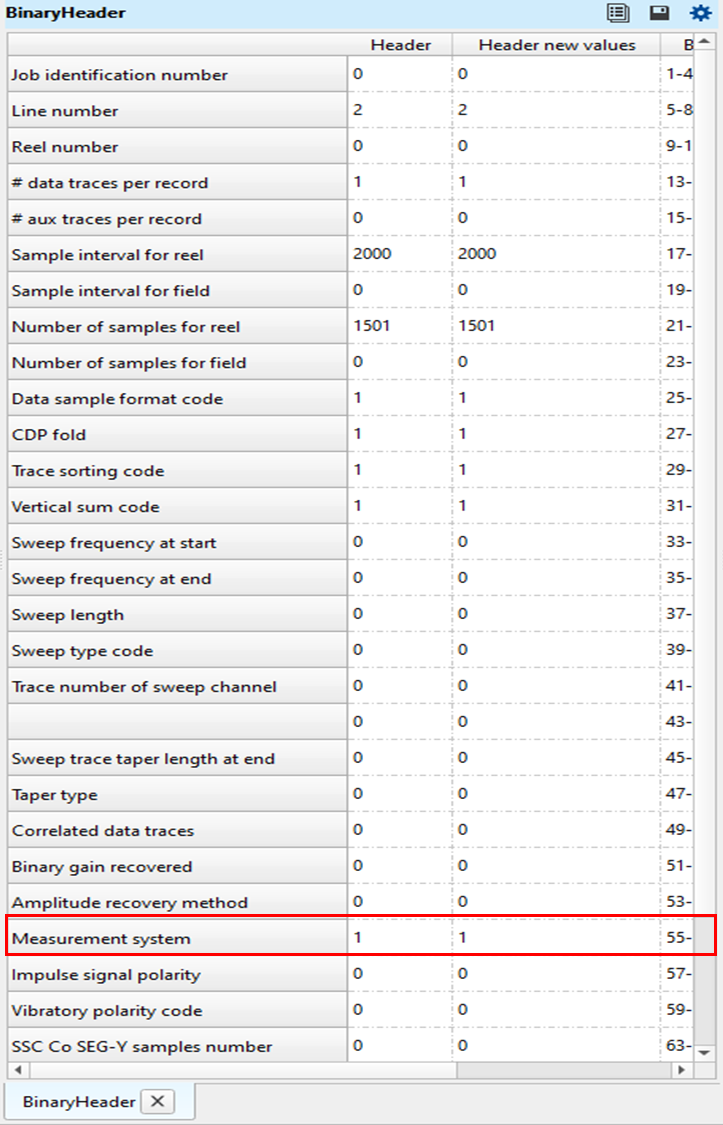
In the same, way the user can change the Binary headers also. In this example dataset, the measurement system is 2 which is nothing but in "Feet". To change the measurement system from Feet to Meters, we go to the Binary headers window and change the from 2 (Header value) to 1 (Header new value). Here also, when we change the value the back ground changes from White to Green. To make these changes permanent, click on the "Update binary headers" and click Yes.
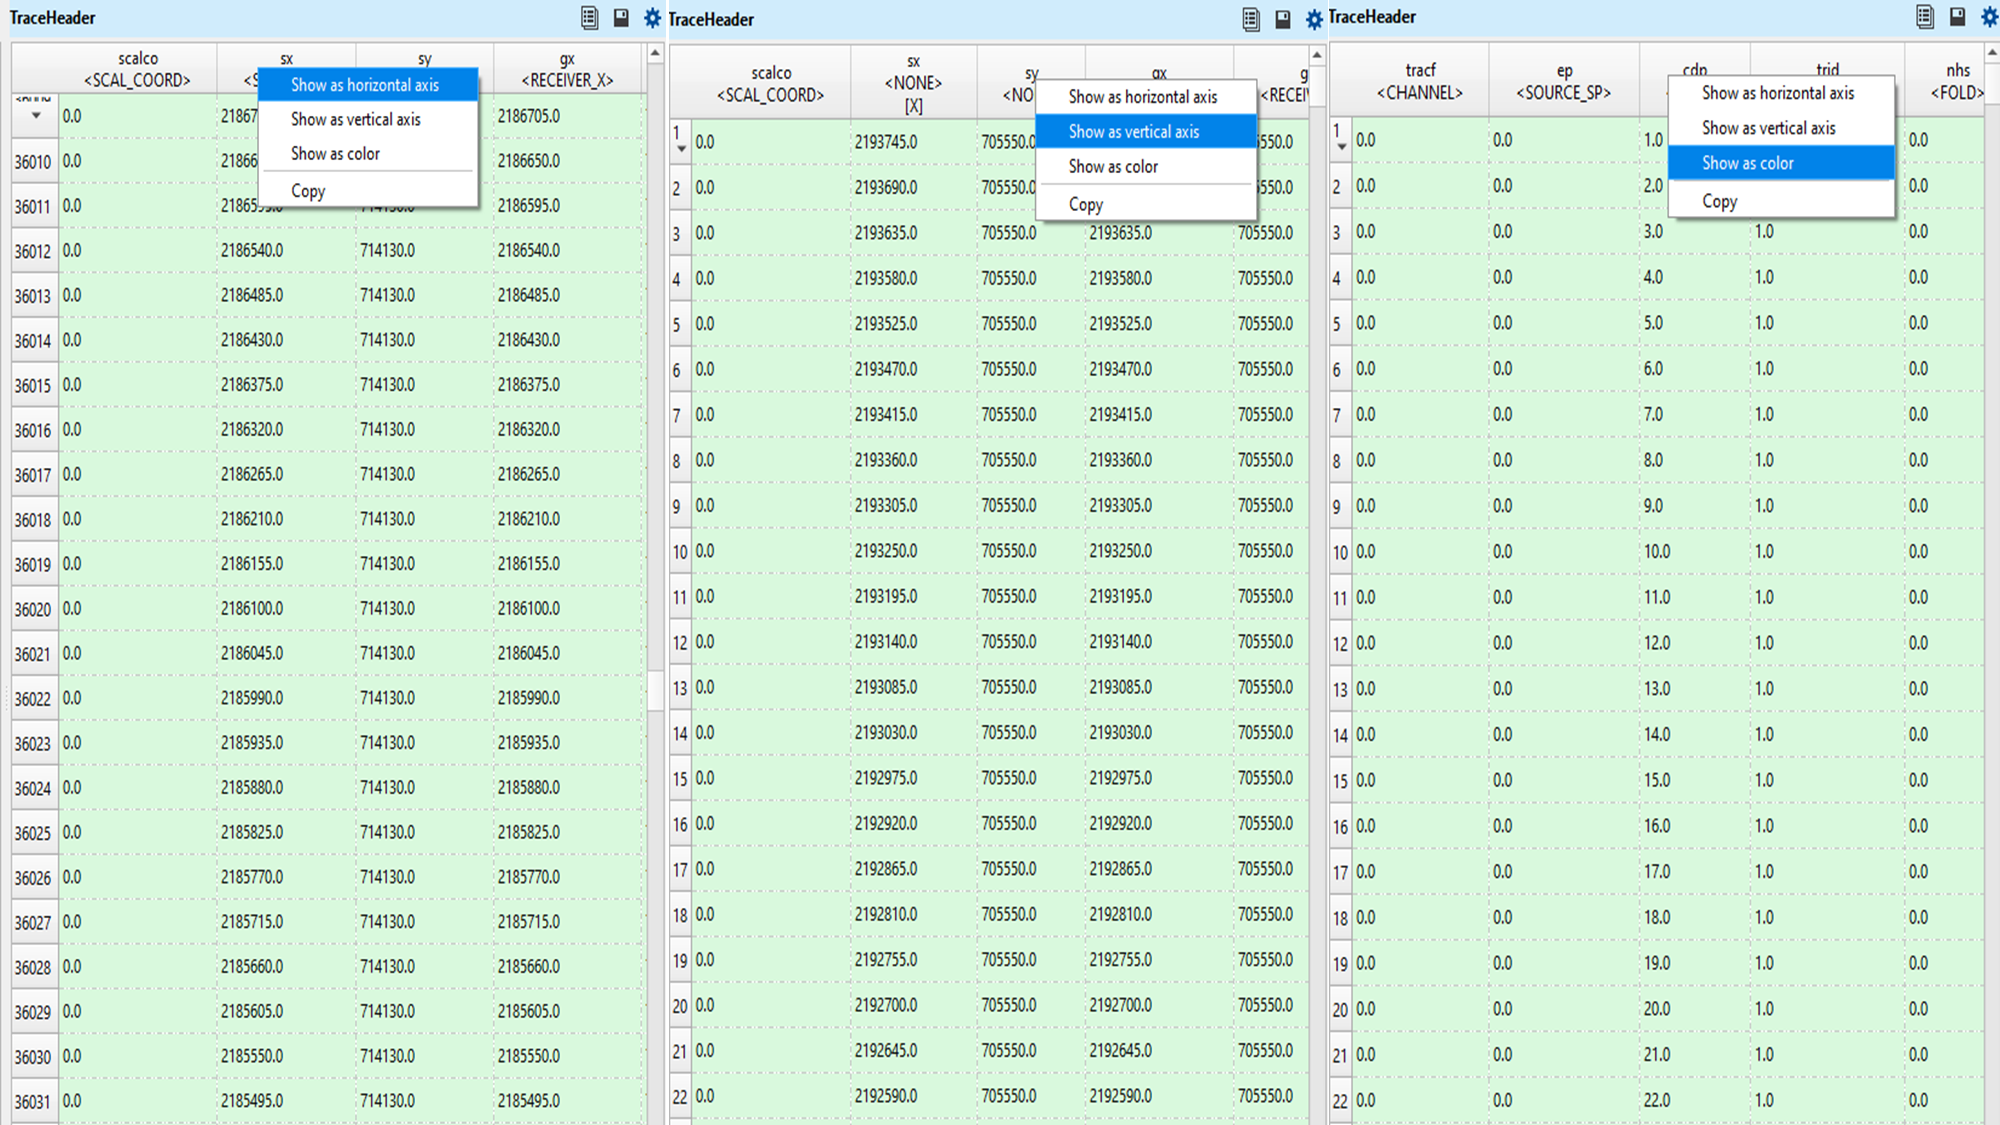
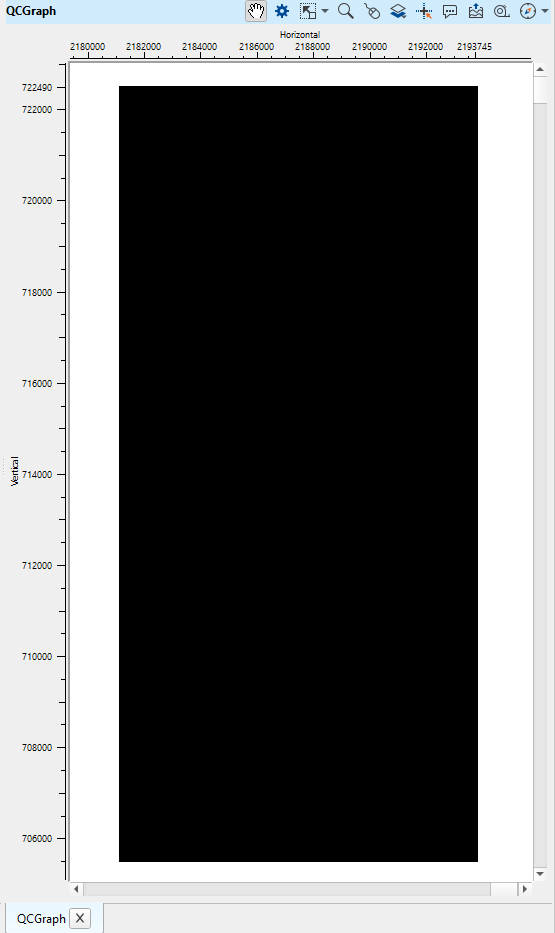
View SEG-Y is also a very useful to quickly QC any of the trace headers. To generate the QC Graph plot, the user should select the horizontal and vertical axes from the trace headers table. In the below example, we are going to plot the QC graph of Source X,Y map. To do that, go to Trace headers window and select Source X. Next right click on the Sx heading. Click "Show as horizontal axis". Similarly, Source Y and select Sy as "Show as vertical axis". Last, we are choosing CDP as a Color. This optional. If we assign any trace header as a color then the QC Graph will appear in Color.
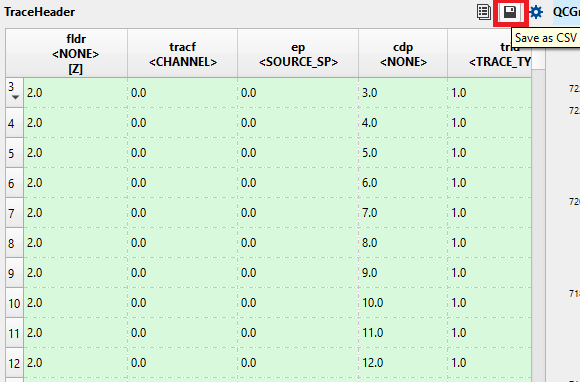
There are more things to do with View SEG-Y module. If the user wants to export the Trace headers into an ASCII file (.csv) format, simply click on the "Save as CSV" icon and it will export into ASCII format.
![]()
![]()
Load all headers - After setting up all the input parameters, the user needs to click on the "Load all headers". Initially, when we execute the View SEG-Y module it will load only few trace headers. In order to get all the trace headers information, one must click on "Load all headers" to access all the information stored in the trace headers
--------------------
Update binary header - This option will allow the user to update any changes made in the binary headers
Update text header - Similar to the binary headers, if the user wants to edit any of the EBCDIC/Text headers, make the changes and click on this option "Update text header" to make the changes permanently.
![]()
![]()
YouTube video lesson, click here to open [VIDEO IN PROCESS...]
![]()
![]()
Yilmaz. O., 1987, Seismic data processing: Society of Exploration Geophysicist
 * * * If you have any questions, please send an e-mail to: support@geomage.com * * *
![]()