g-Space software offers a comprehensive suite of tools for seismic interpretation and geological modeling, enabling users to efficiently analyze and model complex subsurface structures. To help users maximize the potential of g-Space, this section of the manual outlines best practice workflows, illustrated through a demo project based on the Teapot Dome oil field.
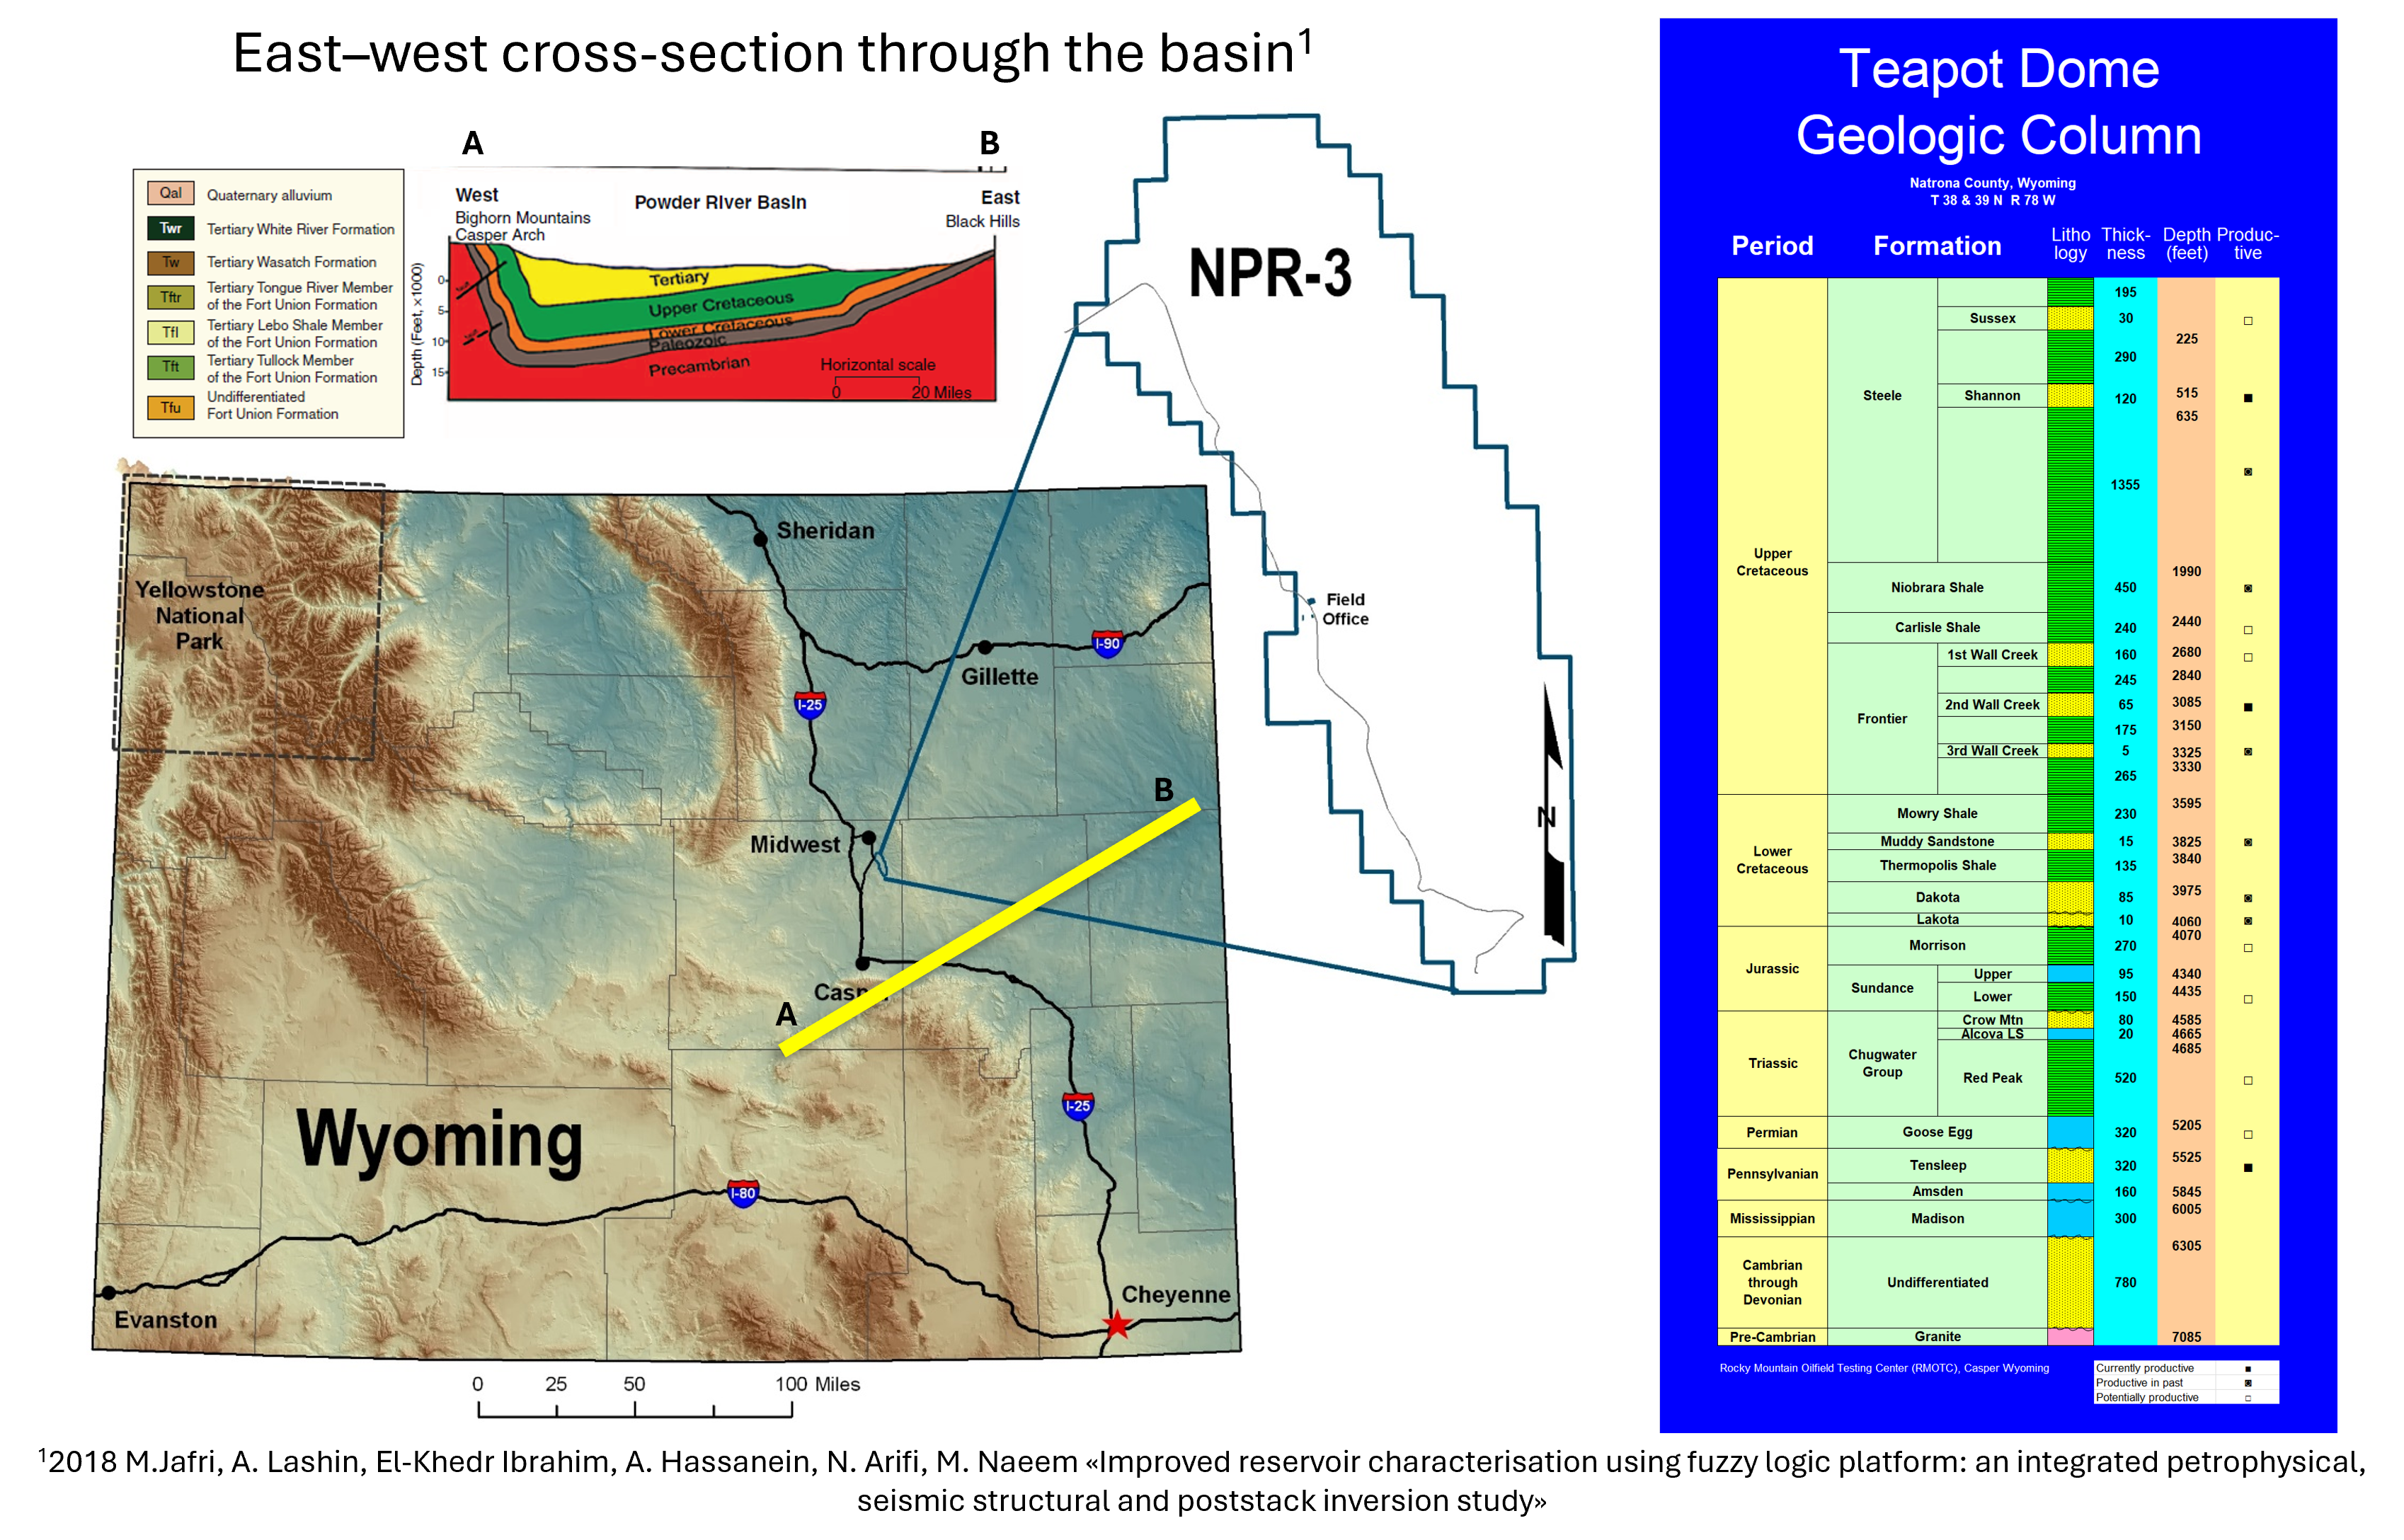
Teapot Dome, located in the Powder River Basin, Wyoming, is a geologically significant field known for its complex structural features and productive hydrocarbon reservoirs. The field primarily produces from the Cretaceous and Pennsylvanian formations, with key reservoirs including the Tensleep Sandstone and the Frontier Formation. The anticline structure of Teapot Dome, formed during the Laramide orogeny, plays a crucial role in trapping hydrocarbons, while regional seals such as the Mowry Shale ensure the accumulation and preservation of these resources.
All data available to the public and can be downloaded here https://wiki.seg.org/wiki/Teapot_dome_3D_survey
This demo project will guide you through the essential steps of seismic interpretation and geological modeling within g-Space, using real data from the Teapot Dome field. By following these best practices, users can effectively build accurate geological models, optimize their workflows, and make informed decisions for exploration and production activities.
When using this manual, remember that the methods in the Help section are tailored to a specific example with a particular dataset. Each geological model is different, with unique data and targets. So, the steps and methods you use may vary. By completing the correlation in the Demo project, you'll get to know the g-Space software interface and learn modeling techniques suited to the training data.
Input data
The following data will be used as initial inputs for seismic interpretation and geomodeling:
•2D and 3D seismic data (all data in feet, SRD=5500 ft above sea level, Vrep=9000 ft/s)
•Results of seismic data interpretation (horizons, faults)
•Well data (wellheads, inclinometry, log data, checkshots, markers)
•Topography
•Boundaries
Please note that all data in the Demo Project is presented in the imperial system of units, with feet as the base unit of measurement. Project coordinate system is 32056 NAD27 / Wyoming East Central.
The following seismic information will be used in the project
2D seismic profiles in SGY-format:
•line_A_ft
•line_B_ft
•line_C_ft
•line_D_ft
•line_E_ft
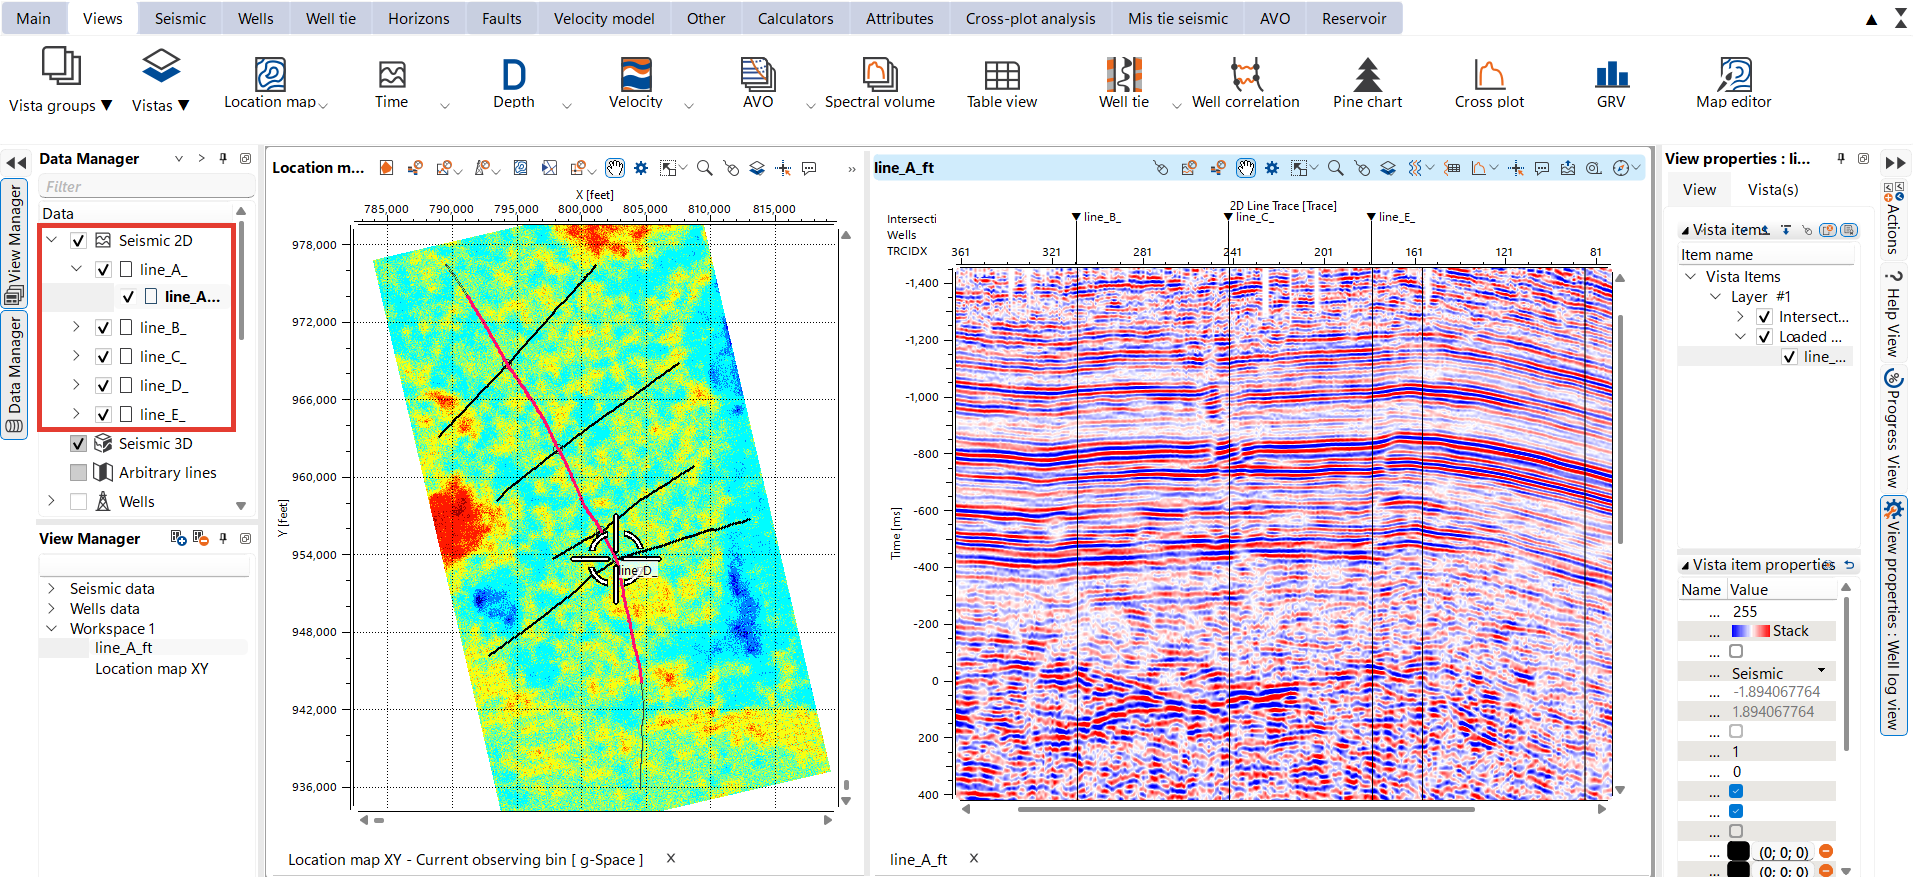
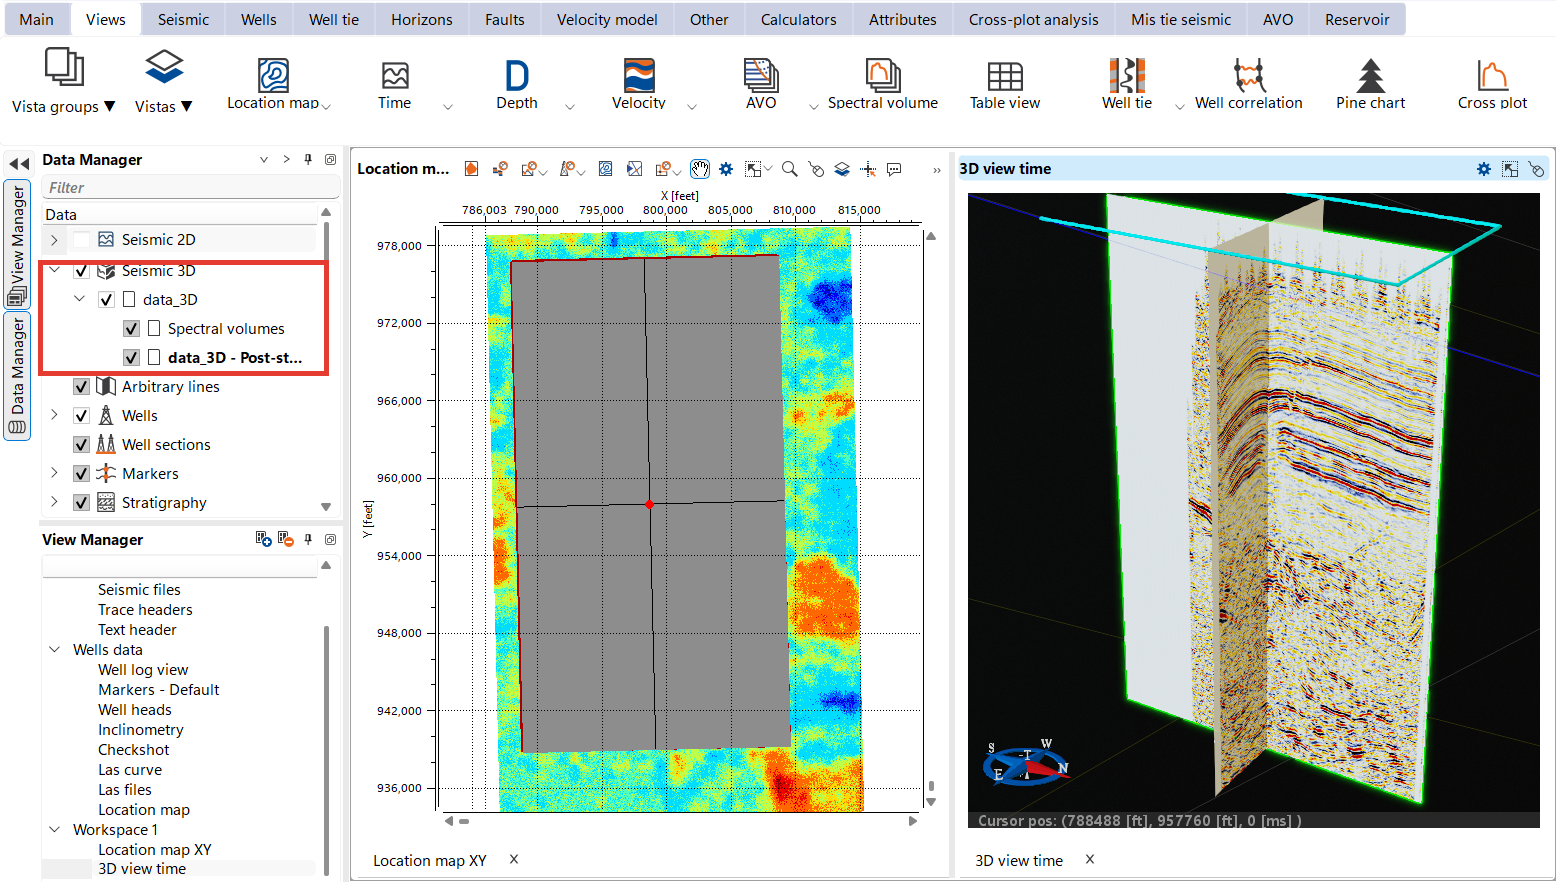
3D seismic volume in SGY-format:
•data_3D_teapot_ft
Inline located in byte 189
Crossline located in byte 193
X coordinate located in byte 181
Y coordinate located in byte 185
There are existed horizons and faults interpretation in the project.
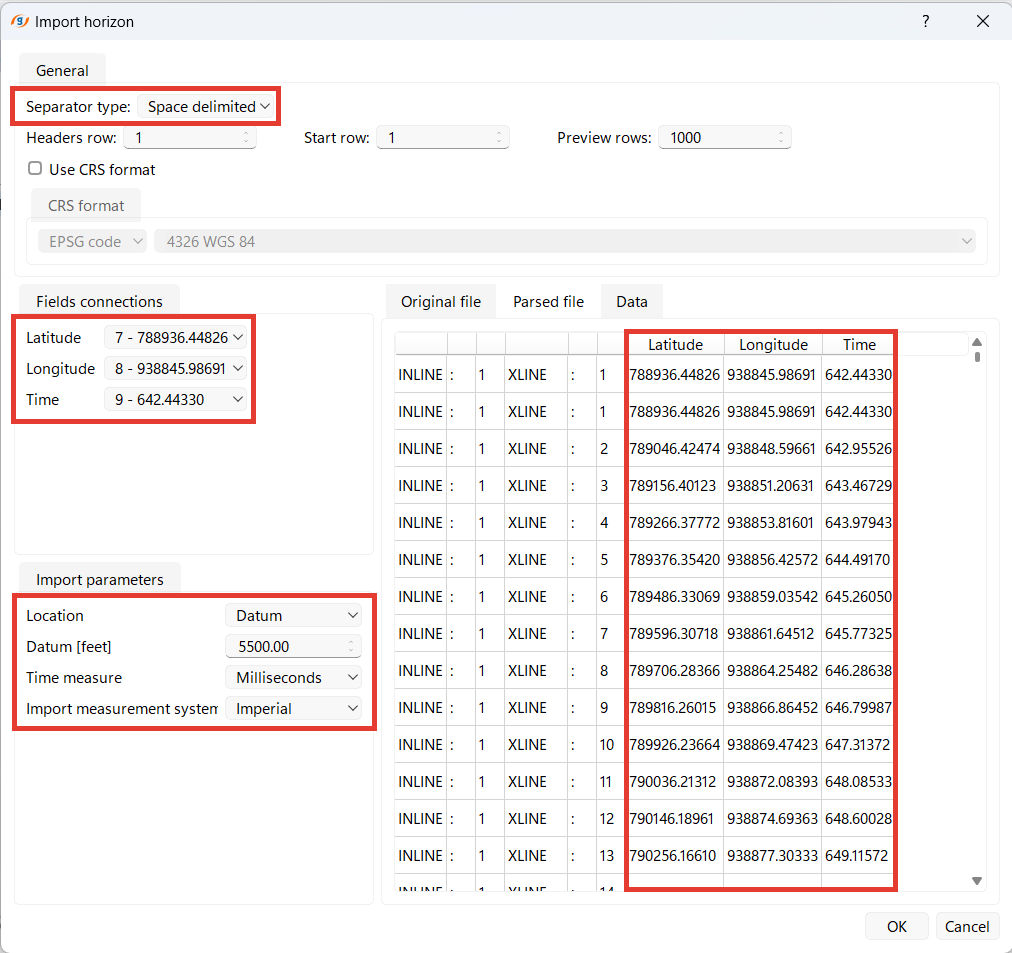
Horizons are presented as text files with inline and crossline numbers and XYZ coordinates.
•Carlile_Shale
•Frontier_2_WC
•Lakota_Sand
•RedPeak_Shale
•SRD_5500_TimeZero
•Tensleep_Sand
•Topo_Time
An example of the file is provided below.
Please be mindful of the system of units and measurement units as well as Datum level
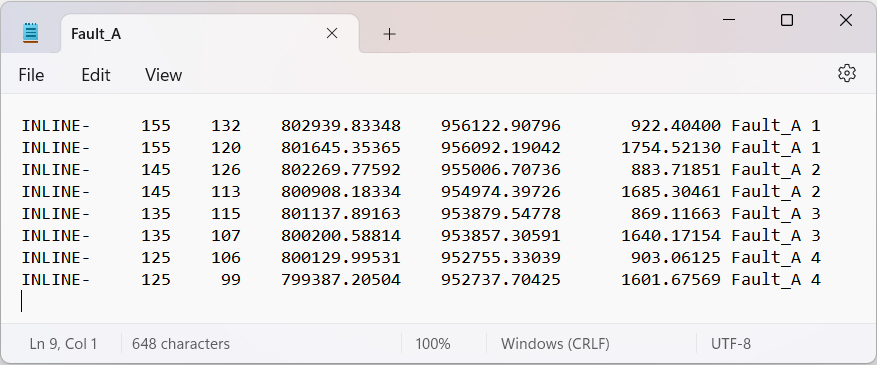
Faults are presented as text files with inline and crossline numbers, XYZ coordinates, Name and Sticks number (Charisma Stick Format):
•Fault_A
•Fault_B
•Fault_C
•Fault_В
An example of the file is provided below.
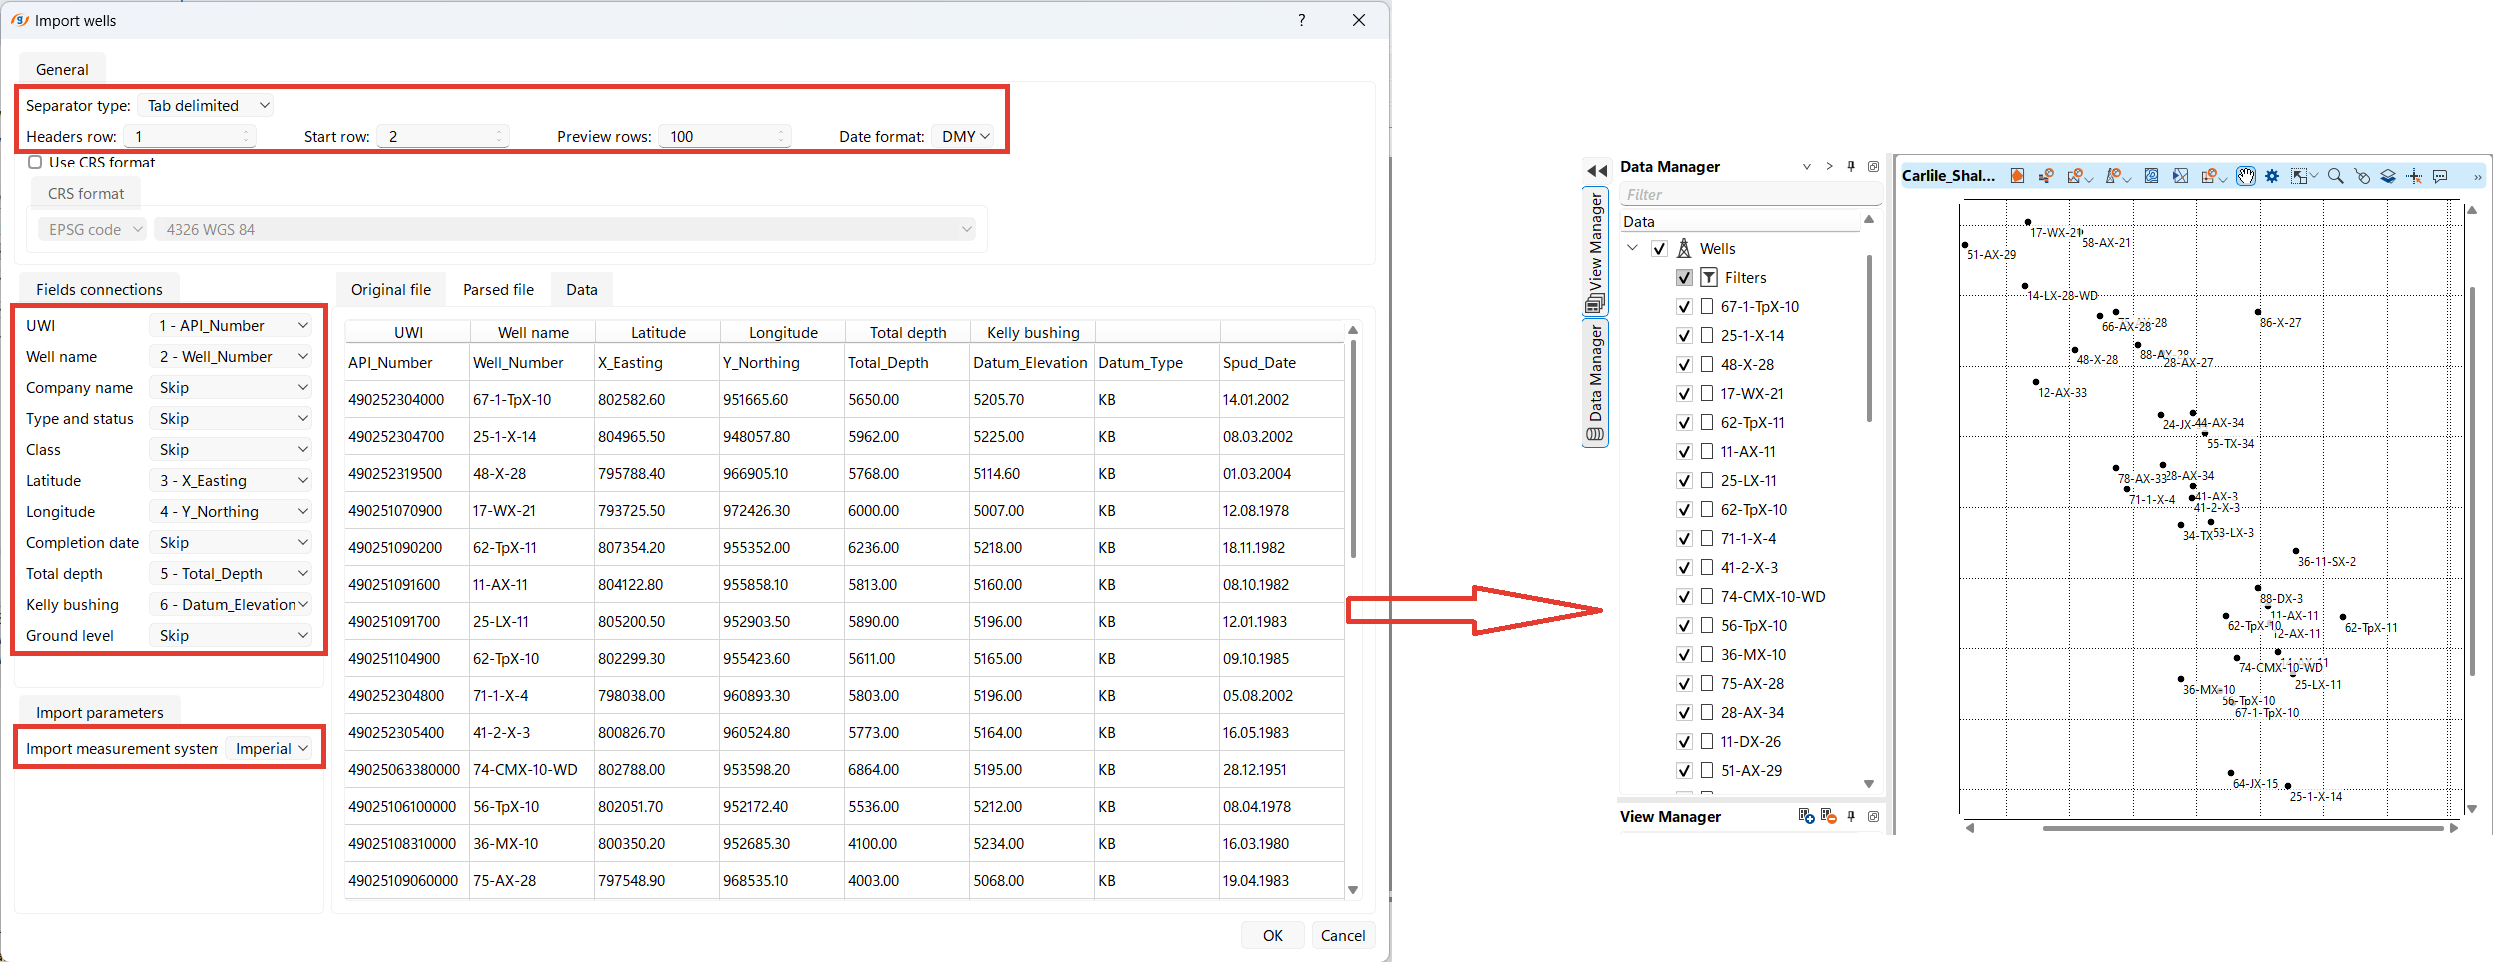
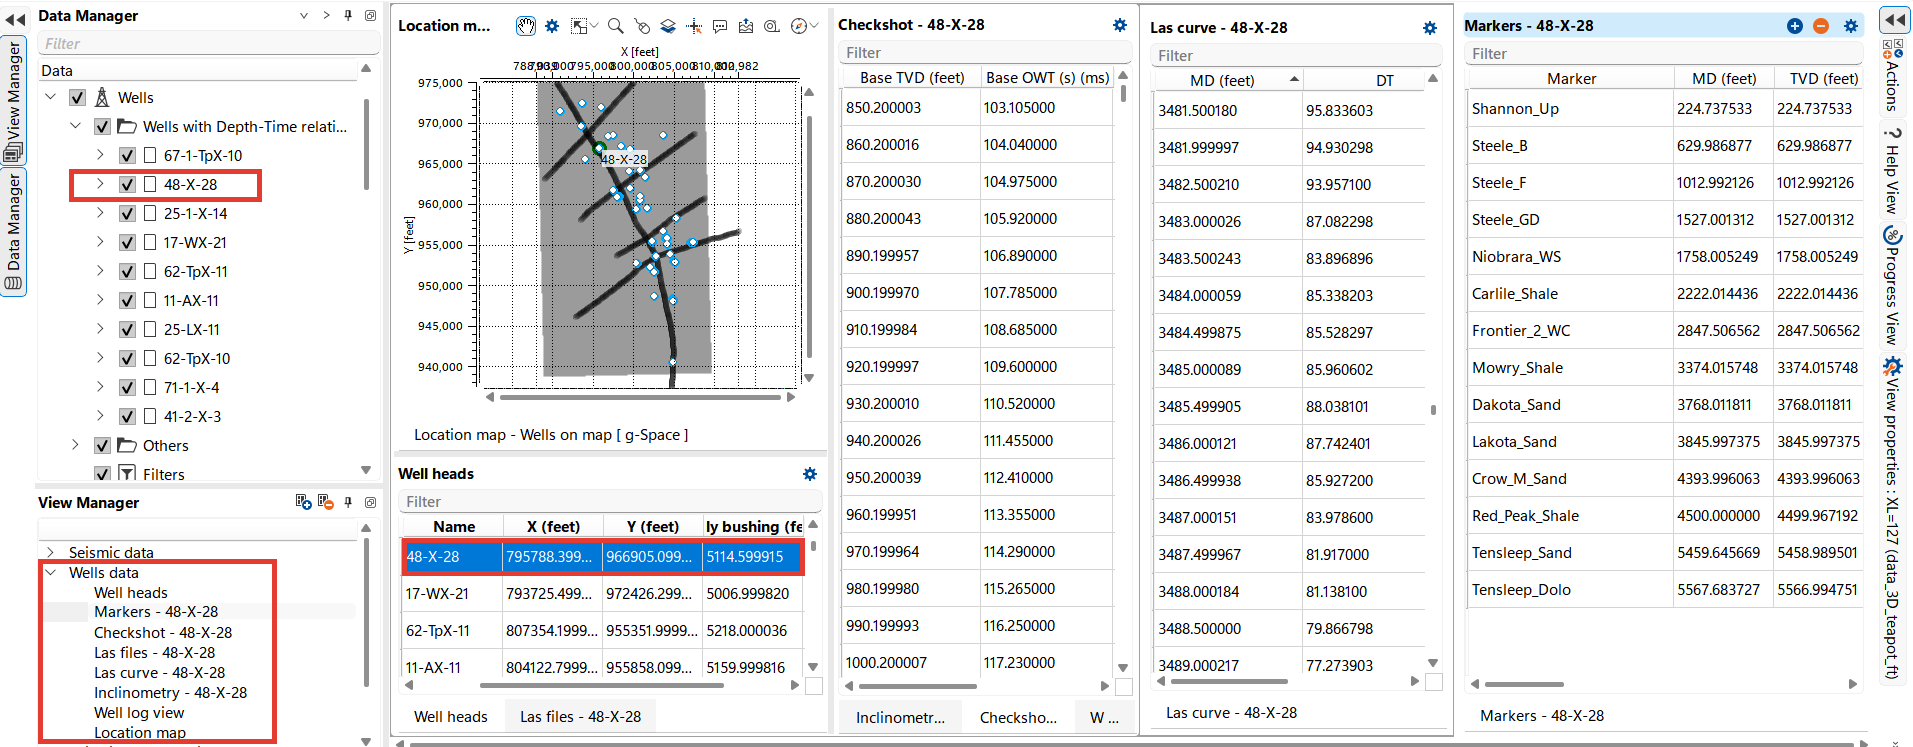
The Demo Project includes 36 wells, each accompanied by wellhead data, inclinometry, log data, and markers. For your convenience, the wells are categorized into those where acoustic and density logging has been performed and those where it has not.
The well heads data is in Well_heads.prn While loading please check parameters highlighted below.
All Coordinates in Wyoming East Central State Plane, NAD 1927
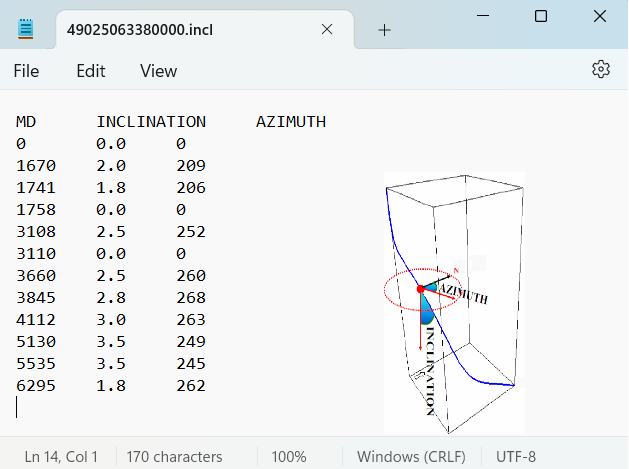
Well inclinometry is presented in the demo project as a set of files in the standard format *incl and includes 2 folders: Wells with long P-wave & Density and Others
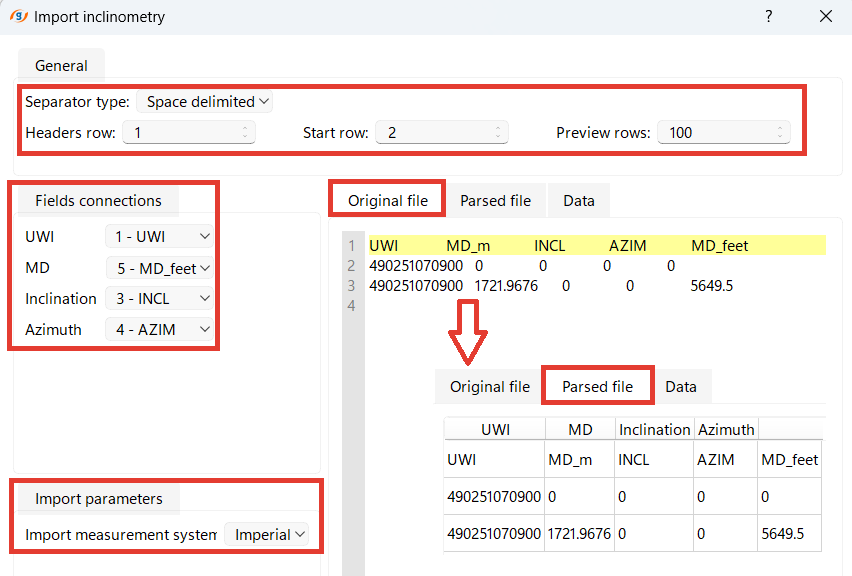
Easily check inclinometry data in the pre-installed Wells Data Workspace, where you can visualize all well data.
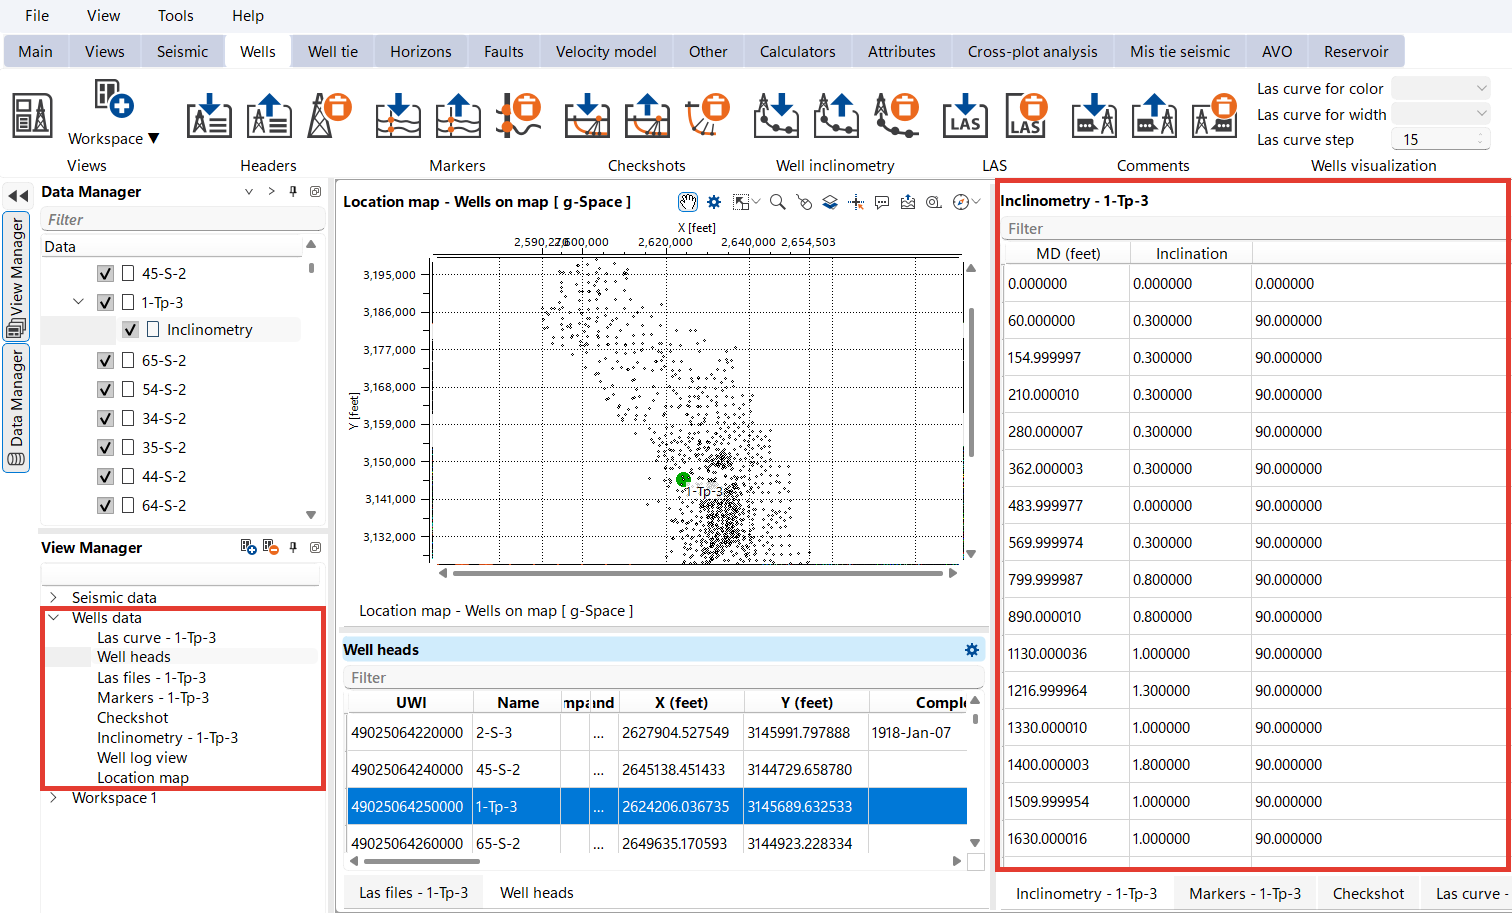
Log data for wells is presented in the form of standard LAS files and contains logging curves including density and acoustic.
Well markers are provided in text format and contain well names, marker names, X, Y, Z and MD.
Below is a list of marker names:
•Shannon_Up
•Steele_B
•Steele_F
•SteeleGD
•Niobrara_WS
•Carlile_Shale
•Frontier_2_WC
•Mowry_Shale
•Dakota_Sand
•Lakota_Sand
•Crow_M_Sand
•RedPeak_Shale
•Tensleep_Dolo
•Tensleep_Sand
Time-depth curves are available for 10 wells in the Demo Project.
It is convenient to view all well data within the installed Well Data Workspace.
The database also includes a polygon with the project boundaries and topography data.
For data uploading, please use Import data instructions.