Wells data workspace
Selection of Wells data workspace View manager activates corresponding workspace that include several views required for QC of the import process for all types of well data.
For more information about well data importing please refer to Import wells
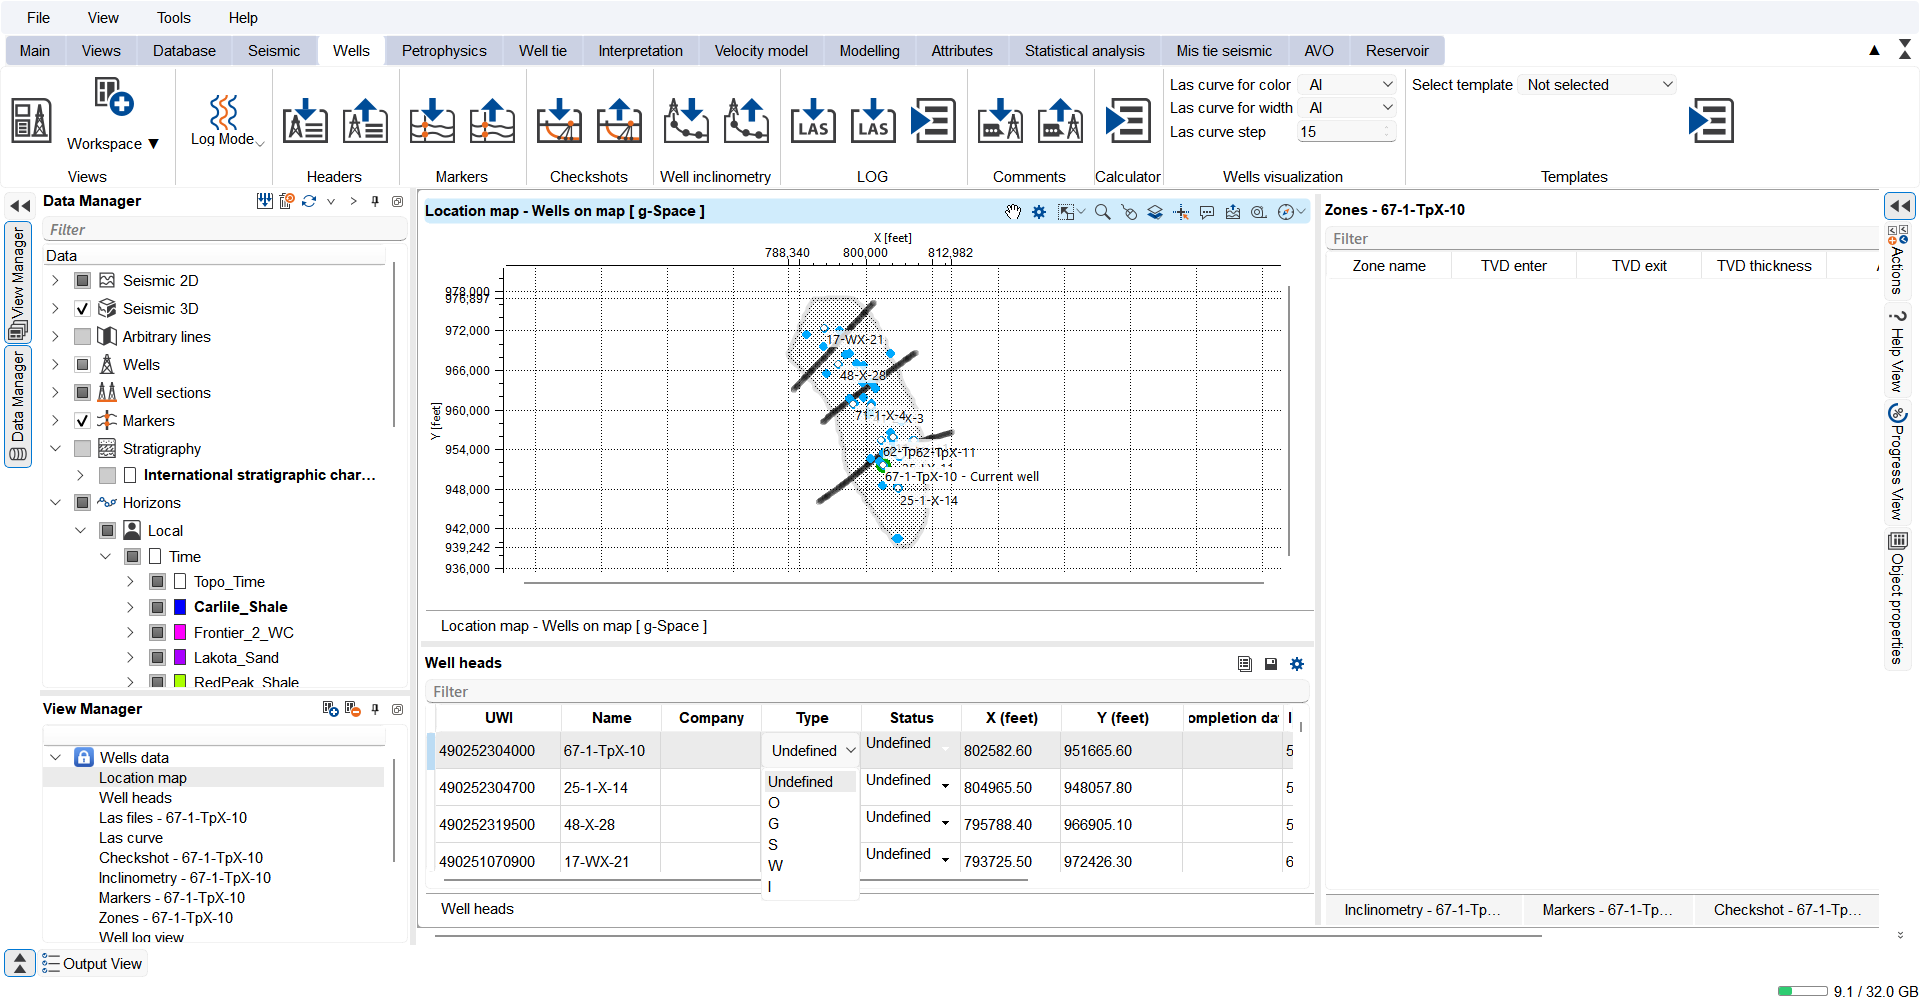
The predefined workspace [Wells data] includes following views:
Location map view - shows all wells that currently loaded into the project. That view reflects:
- type and status of the well - icon of the well according ( description of codes for well status can be found in https://www.ogsrlibrary.com/definitions_well_status_oil_gas_ontario)
- existence of markers loaded into the well - blue circle
- existence of checkshot information - violet circle
- existence of well logs loaded from LAS files - orange circle
- existence of deviated inclinometry of the well - black line drawn from the well location
Clicking a well on the Location map refreshes all the workspace tables for that well, allowing rapid QC.
Well heads view - shows all wells header information loaded into the project. The table columns are UWI, Name, Company, Type, Status, Icon, X, Y, Completion date, Total depth (MD), Kelly bushing and Ground level. To edit the classification, choose a value from the Type or Status drop-down in the table. In the Icon column, choose From Type and Status to keep the automatically derived map symbol, or choose a specific icon to use that symbol on the Location map.
Markers view - shows all markers loaded for selected (current) well. The title of the view shows the name of the current well. For each marker the table lists the attributes Marker, MD, TVD, TVDSS, TWT, X, Y, Age and Type. Any custom marker attributes defined on the marker set appear as additional columns.
Zones view - shows the zones of the project with the interval each of them covers in the selected (current) well. The title of the view shows the name of the current well. For each zone the table lists Zone name, TVD enter, TVD exit, TVD thickness, Age and Type. TVD enter and TVD exit are the depths at which the well enters and leaves the zone, TVD thickness is the interval between them, Age is taken from the top marker of the zone, and Type is always Zone. A cell stays empty when the value is not available: when the well has no pick for the top or the base marker of the zone, and for TVD thickness also when the base marker lies above the top one. Until a well is selected, the table lists every zone of every well and starts with an additional Well name column. The table is read-only; its values follow the marker tops the zones are built from. For more information about creating zones from markers please refer to Markers
Checkshot view - shows all checkshot values for the selected (current) well. The title of the view shows the name of current well. User can double click on any value and edit it.
LAS files view - shows all well logs loaded for selected (current) well. The title of the view shows the name of the current well.
LAS curve view - shows all values of selected well log of selected (current) well. User can double click on any value and edit it.
Well log view - for visualization logs and markers.
Imported NMR array channels appear in Spectrum tracks in the Well log view. See Well correlation view for the shared display controls.
An array channel marked Borehole image during import appears automatically in the Well log view, in a track named Image log: followed by the channel name. See Well correlation view for the shared image display controls.
Inclinometry view - shows all inclinometry points for selected (current) well. The title of the view shows the name of current well. For each survey point the table lists MD, Inclination and Azimuth, together with the g-Space-calculated X, Y, TVD and TVDSS.
Table values can be copied with the Copy tool and pasted into Excel. Editable fields (for example checkshot values) are changed by double-clicking the cell.