This chapter will help you get started with well correlation.
Subscribe to our channel and watch the video on how to correlate wells in g-Space on YouTube
Information about wells data loading you can find here.
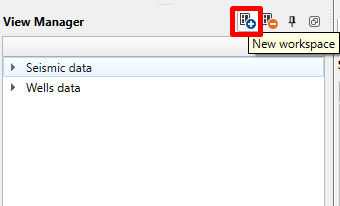
Once the data has been successfully loaded, proceed to the View manager panel. Create a new workspace and assign it a suitable name:
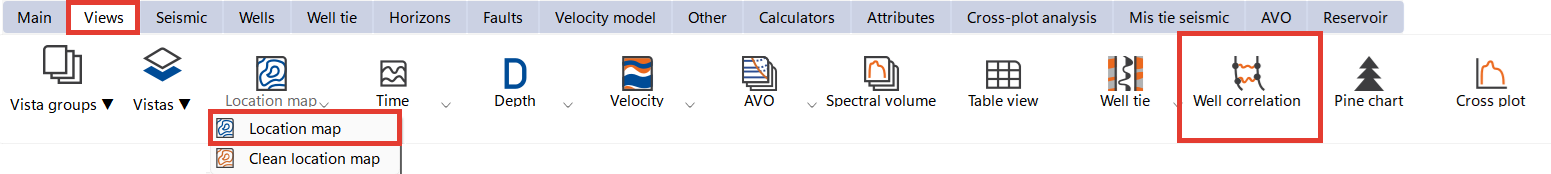
Create two views: Location map and Well correlation
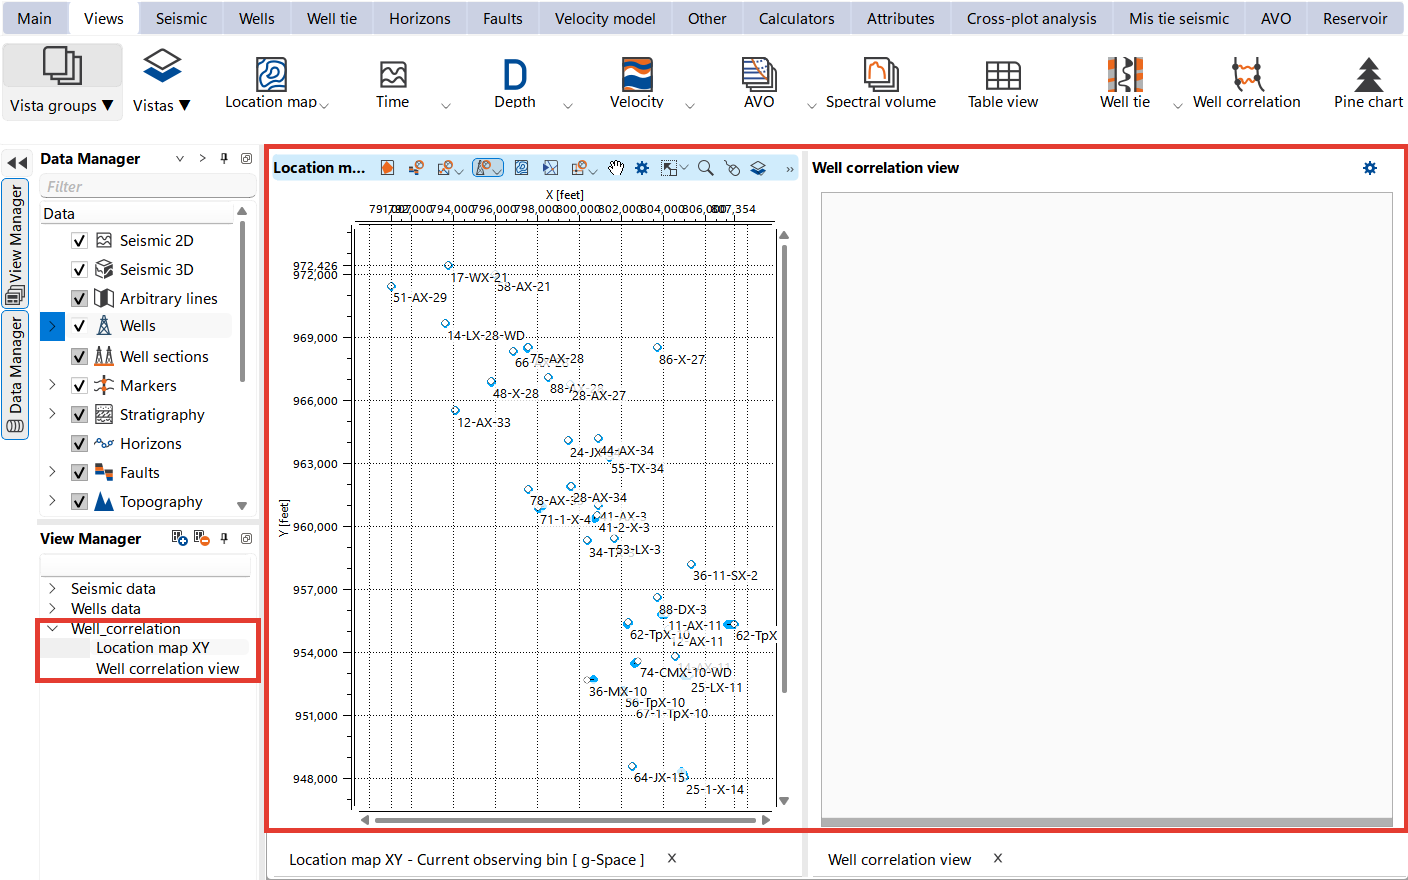
Now there are two views in your workspace
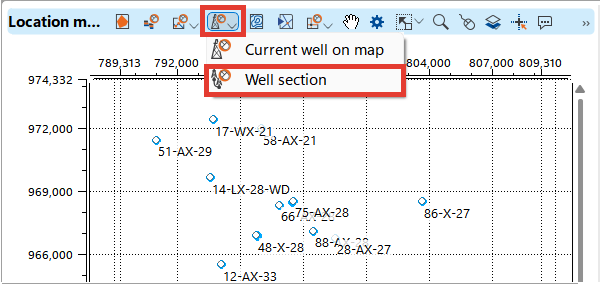
To create a Well correlation section, click the Well button on the tool panel in the Location map view and select Well section.
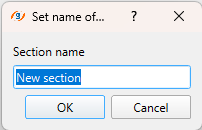
On the first well, g-Space creates a well section and prompts you to name it
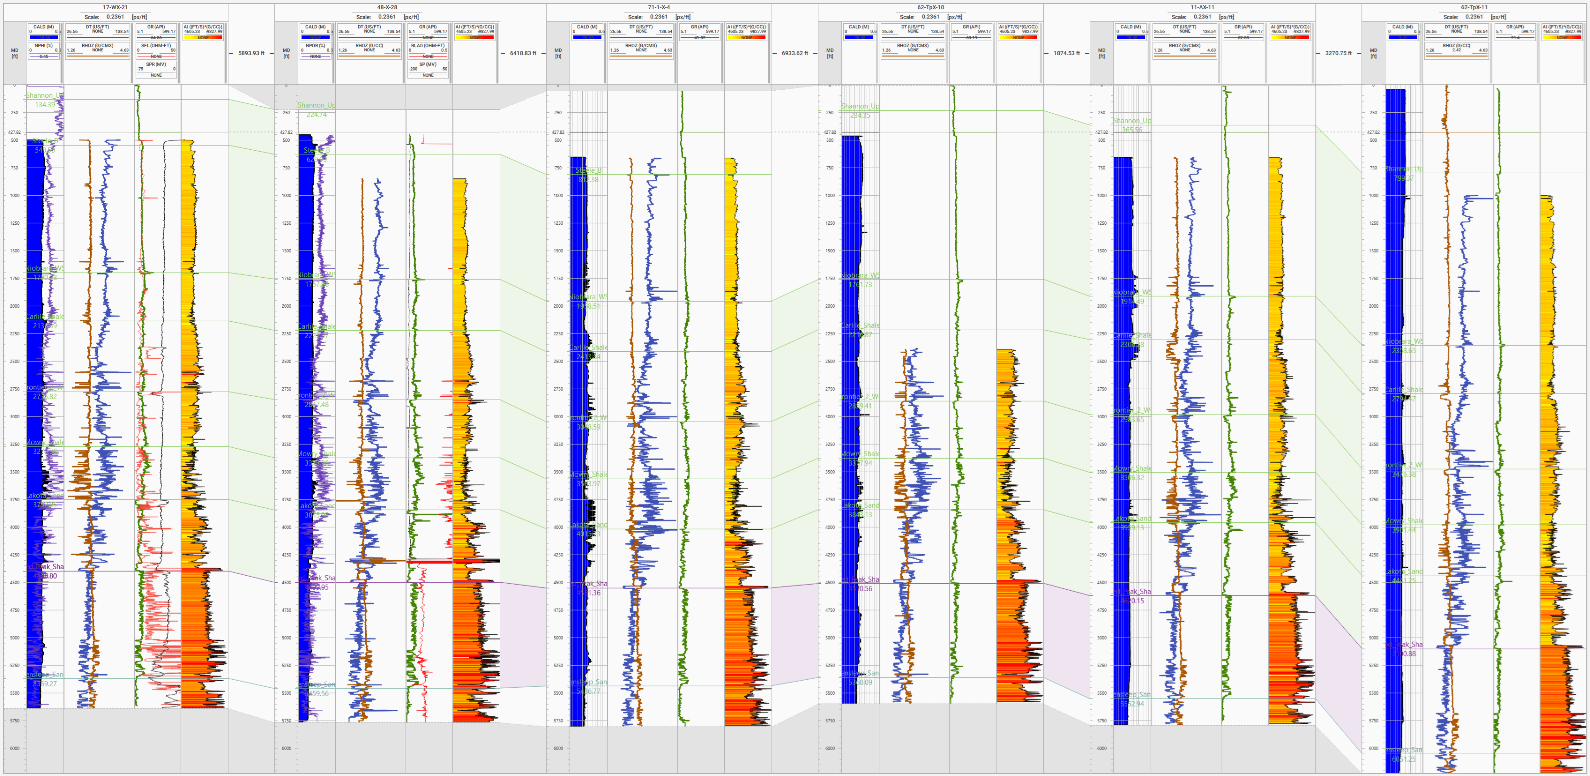
Choose the wells you want to add to your section. The selected wells will appear in the Well correlation view. This workspace is where the core of your correlation work takes place, allowing you to visually compare and align well logs, stratigraphic markers, and other key data across multiple wells.
The simplest way to build a section is directly from the Data Manager: check the box next to a well. If no well section exists yet, g-Space prompts you to create one and name it. Each additional well you check is then added to the active well section.
Effective well correlation often requires tailoring the display settings to highlight the most relevant data for your analysis. Here’s how you can customize your Well Correlation view:
Accessing Visualization Settings:
To adjust the appearance and properties of any object in the correlation window, simply right-click on the object. This will bring up a menu of visualization options where you can modify aspects such as color, scale, and labeling.
Settings are organized in three levels, each reached by right-clicking a different area:
•Global — right-click the well name at the top of the well section.
•Track — right-click the top of a track.
•Curve — right-click the curve header.
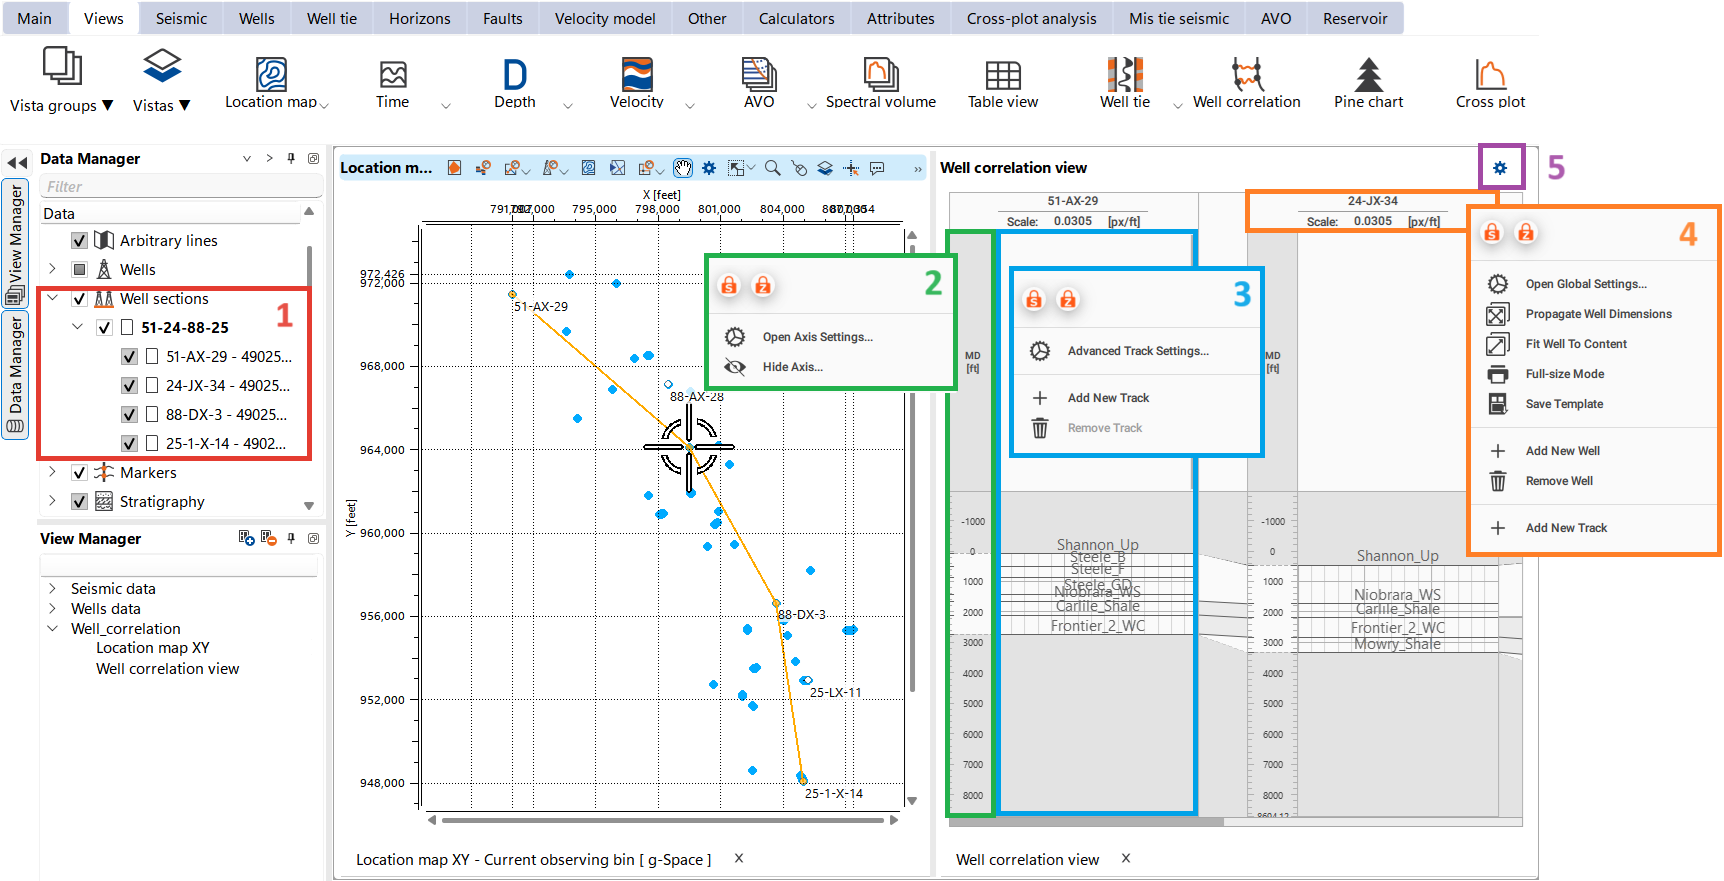
Let's examine the workspace of the Well correlation view.
1.Managing Well Sections in Data Manager:
As you create and modify well sections, they will automatically appear in the Data Manager. This allows you to keep track of your sections and manage them alongside other project data.
2.Adjusting Axis Settings:
The axis settings provide control over the visualization of depth, time, and other relevant axes. You can customize parameters such as axis names, scales, colors, and label sizes to ensure the display is clear and informative.
3.Configuring Track Settings:
Each track in the correlation view — whether it's a log curve, stratigraphic marker, or another data type — can be customized to suit your analysis. Track settings include options for visualization, adding markers, and adjusting display properties.
4. Saving Well Templates for Future Use:
Once you've configured a well template that fits your needs, save it within the Well settings. This template can be easily recalled in future projects, streamlining your workflow and ensuring consistency across your work.
5. Exploring Global Settings:
The global settings in the Well Correlation view offer a comprehensive suite of tools for refining your correlation. These tools are described in detail within the Well correlation View section of the Help documentation, providing guidance on advanced customization and usage.
Notes
1.Consider the structural framework of the area, such as faults, folds, or unconformities. These features can disrupt or offset geological layers, making correlation more complex. Recognizing these structures early on can guide your correlation and prevent errors.
2.Start your correlation with key wells that have the most reliable and detailed data, such as wells with core samples, high-quality logs, or known stratigraphic markers. These key wells serve as anchors, providing a solid foundation for correlating other wells with less detailed information.
3.Use multiple wells to cross-check correlations, especially in complex geological settings. This approach helps to validate the continuity of horizons and reduces the risk of misinterpretation.
4.Be aware that well logs from different wells may not always correlate perfectly due to differences in data quality, measurement methods, or geological variations. In such cases, use your geological knowledge to interpret these discrepancies rather than forcing a correlation.
5.If available, use seismic data to tie well correlations to broader regional interpretations. Seismic horizons can provide additional context and help validate well correlations, especially in areas with complex geology. Generating synthetic seismograms from well logs can help bridge the gap between well data and seismic interpretation.
6.Keep detailed records of your correlation process, including decisions made, marker positions, and any adjustments. This documentation is crucial for future reference and for communicating your findings with others.
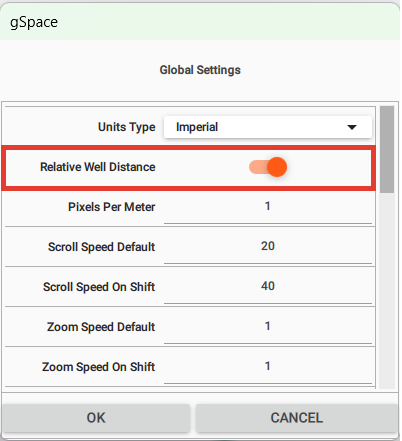
To accurately represent the proportional distance between wells on the correlation diagram, utilize the Relative Well Distance function found in the Global Settings.
After customizing your Well Correlation view and adding necessary markers, review your correlation to ensure accuracy and consistency across all wells.