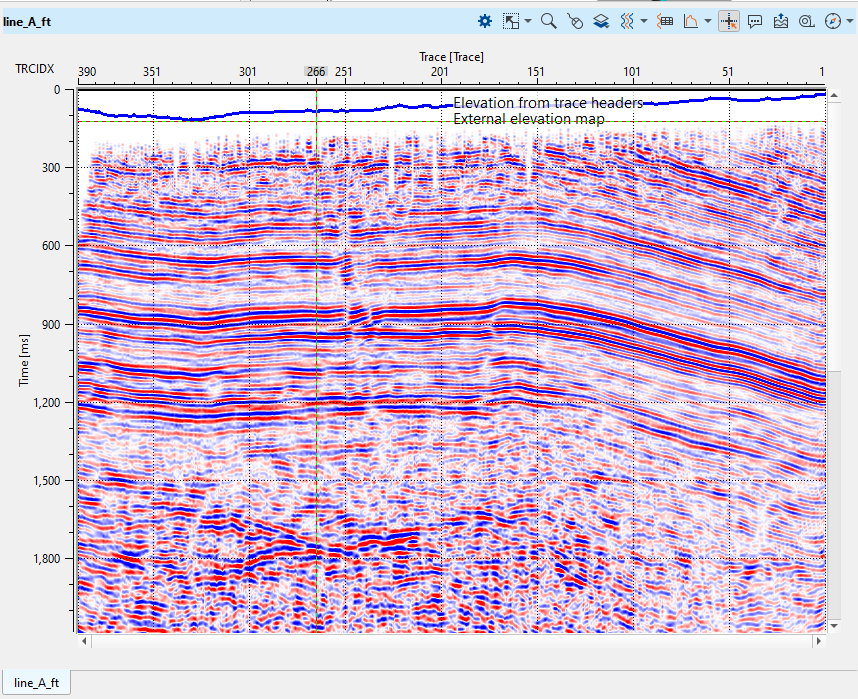
Seismic data is the main display window where the user can able to visualize the entire dataset within a window. The entire dataset is loaded into the memory and display the full content of the data in the seismic data window. However if the user zoom in/out in any part of the Seismic data then that particular section of the display will be displayed on the screen.
Within the seismic data window, we have many option to visualize the data. For an example if the user wants to display the Offset plot on the top of the annotations, it can be done fairly easy. Before that we need to introduce various icons on the top of the seismic data window each got it's own significance.
1. Show properties
This will open up a pop-up window to change the display settings like placing annotations on the top, changing the color of the display from density to wiggle, applying AGC etc.
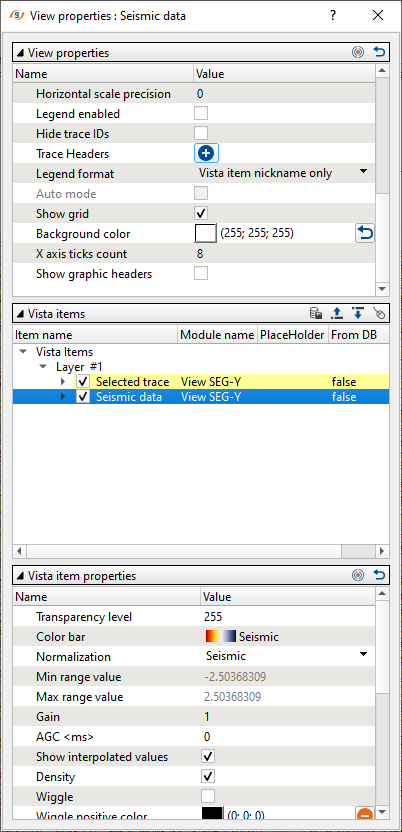
Show properties is designed into 3 parts.
Visual Settings predominantly takes care of Trace headers annotations , showing graphic headers etc.
Object items deals with the main components of the data like seismic data, selected trace, selected shot gather etc
Object item properties helps in adjusting the gain, AGC, change the color bar, applying Band pass filter etc.
2. Adjust to size ![]() :
:
This option adjust the display size into the original position. Zoom Out.
3. Set/Unset zoomable![]() :
:
If the user wants to zoom a particular area, simply click on the icon to activate the zoom and draw a polygon on the seismic data to zoom that particular area. Please note that after the initial operation, the icon resets to zoom out position and the user needs to reselect the set/unset zoomable icon to zoom again.
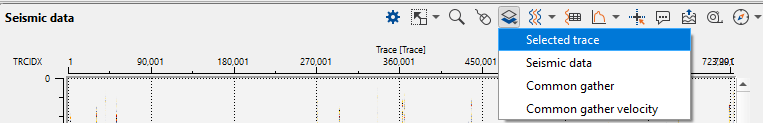
4. Set control item![]() :
:
This icon helps in selecting any particular item inside the seismic data window. For instance, if the user wants to select a trace then click on Set control item icon and it will give the options to choose. In this instance we have only one option i.e. select trace.
![]()
5. Add Object ![]() :
:
This icon helps us to add any Object items like as shown below.
6. Select traces ![]() :
:
By selecting this icon, the user can able to select a trace. Besides this, we have an option to clear to Clear the selection and Export to file option if the user click on the downward triangle right next to the Select traces icon.

7. Trace headers table ![]() :
:
This option will work in tandem with the Select traces module. The trace headers information should be available in the Trace data window.
8. Spectral Analysis ![]() :
:
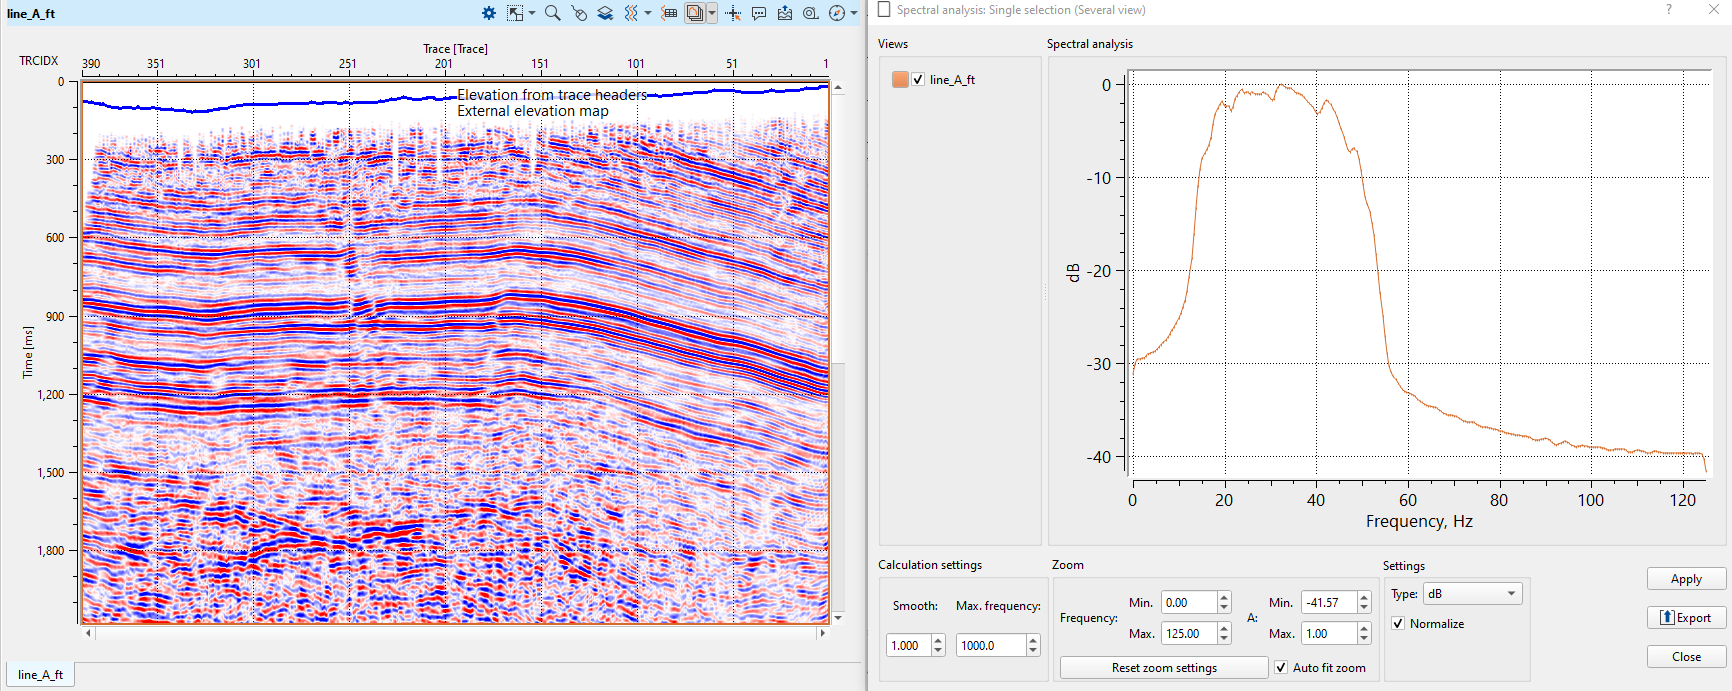
Within g-Viewer the user has the ability to analyze the amplitude and frequency of the seismic data via a spectral analysis. To perform this the user should go to either the Seismic data or the Common shot/receiver/bin tab.
Within the Spectral analysis icon, we have two options. Multiple selection (single view) and Single selection (Several view). By default, it will display the Single selection (several view).

Click on the Spectral analysis icon and it will generate the spectral analysis window as shown below. By default Single selection is selected and the corresponding spectrum is displayed. In the below image, we can see that the entire stack section is selected and the corresponding spectrum is displayed in a separate window.
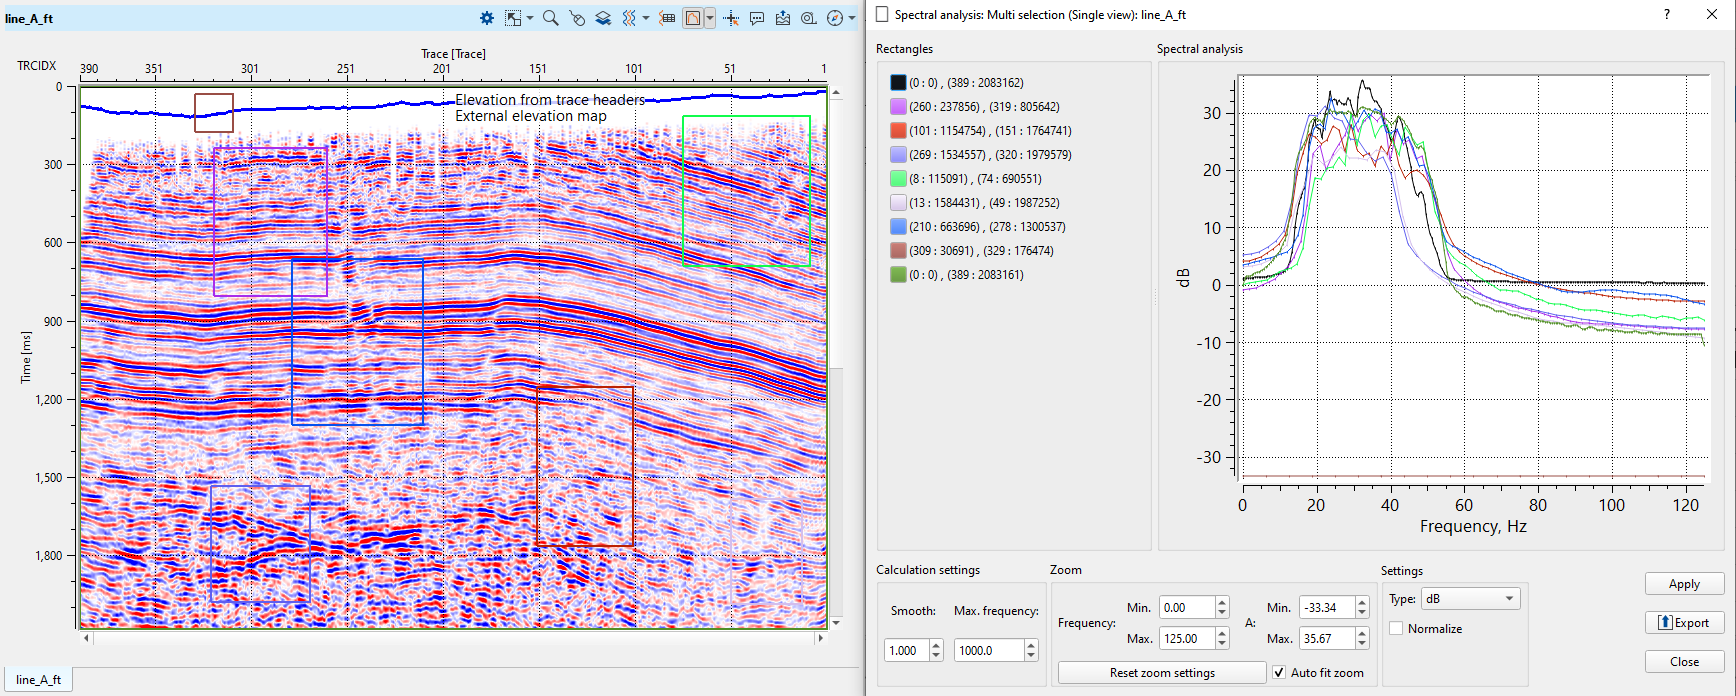
If the user wants to analyze different areas in a display then select the “Multiple selection” option and draw as many areas as desired to display the spectral analysis. To draw a polygon, simply hold and drag MB1 button at the desired location on the display window. Several window selections and their corresponding spectra are displayed below.
9. Set/unset mouse tracker ![]() :
:
When the user selects this option, it will show the dotted horizontal and vertical lines to show the mouse tracker as shown below.
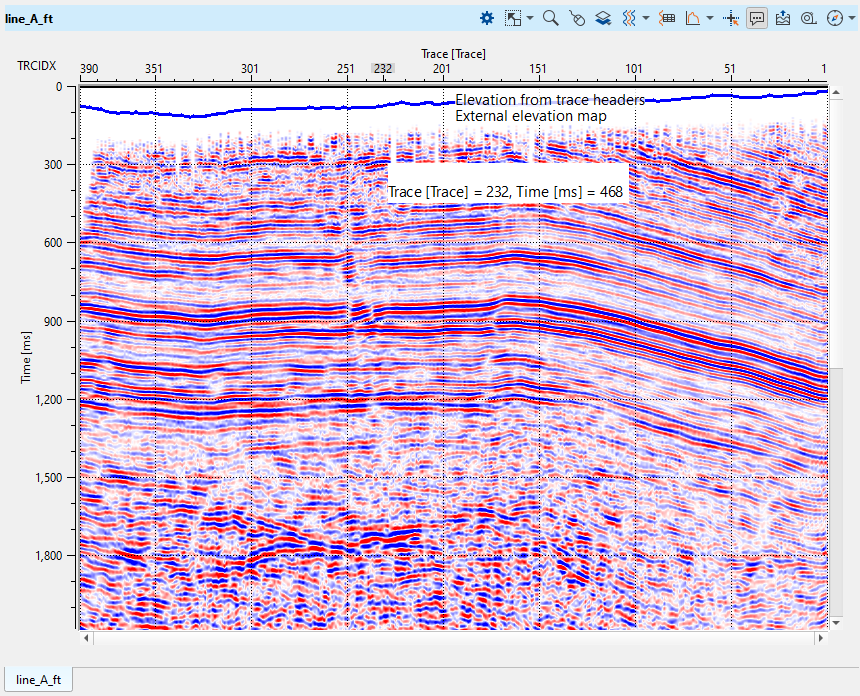
10. Tool tip ![]() :
:
Upon selecting this option, it will display the available information depending on the cursor position.
11. Export picture ![]() :
:
The user can able to import the images with different formats for future needs like power point presentations etc.
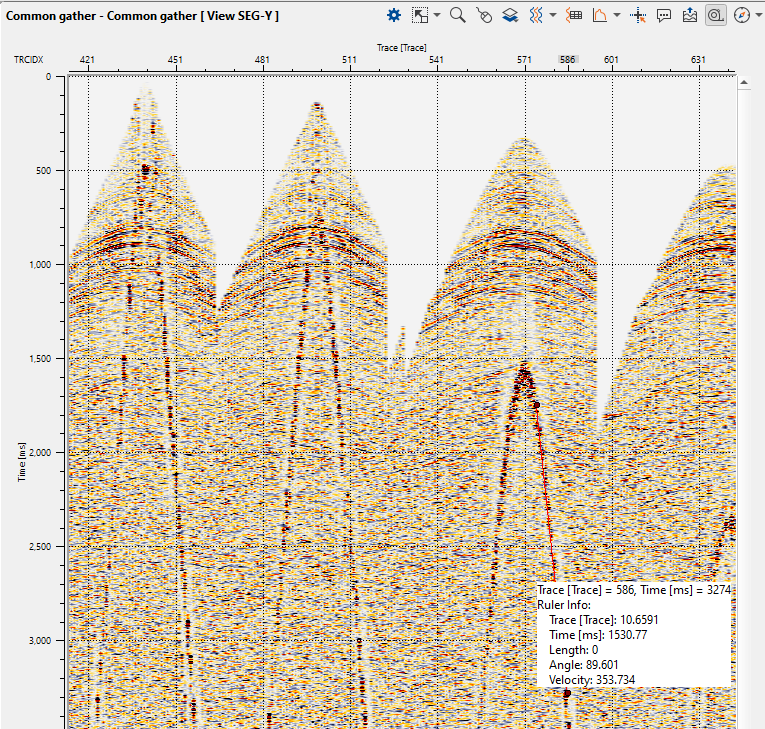
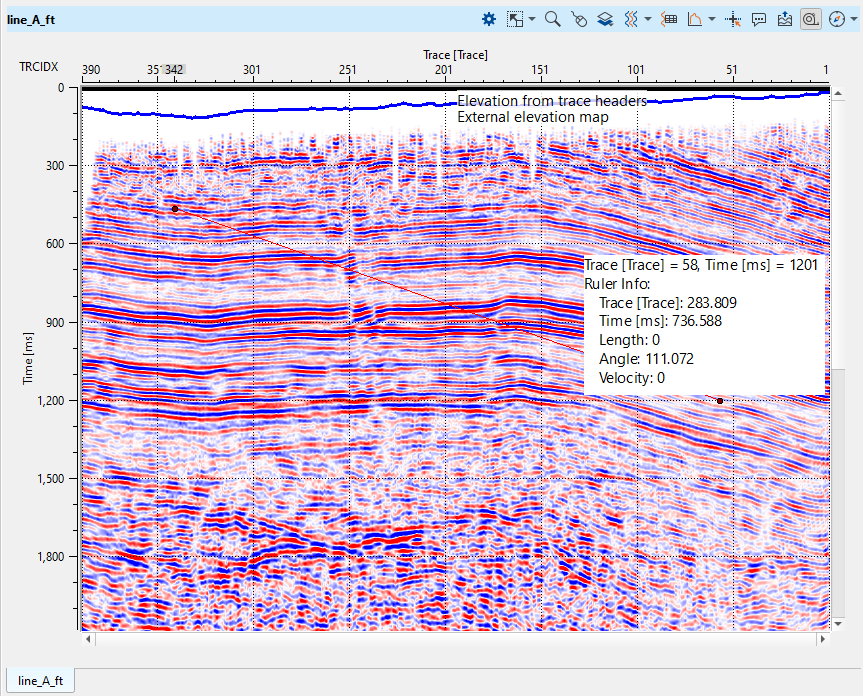
12. Ruler![]() :
:
This is a very useful tool especially for Prestack data. For an example, we want to measure the velocity of an event. To achieve click on the Ruler icon and hold MB1(left mouse button) and draw a line. It will display the information as a tool tip as shown below. In case of post stack data, it isn't that informative.
13. Miscellaneous
The Miscellaneous icon provides additional tools that enhance the seismic data interpretation experience. These tools add orientation, scale, and context to the data being visualized, especially in spatially complex environments. The main components include:
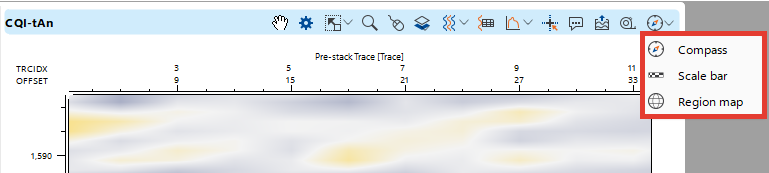
- Compass ![]() Displays an orientation guide within the seismic data window, helping users to maintain a clear sense of direction.
Displays an orientation guide within the seismic data window, helping users to maintain a clear sense of direction.
- Scale bar ![]() Adds a scale reference to the display, allowing the user to visually gauge distances across the seismic section.
Adds a scale reference to the display, allowing the user to visually gauge distances across the seismic section.
- Region map ![]() Shows a miniaturized map view of the region or data coverage area, providing spatial context for the seismic data being analyzed.
Shows a miniaturized map view of the region or data coverage area, providing spatial context for the seismic data being analyzed.