The Band-Pass Analysis feature in g-Viewer enables users to analyze the frequency spectrum of seismic data by selecting specific areas within a dataset.
Multiple Selections Within a Single Seismic Dataset enables users to select multiple regions within a single seismic dataset for spectrum analysis.
Workflow:
•Open a seismic dataset in g-Viewer.
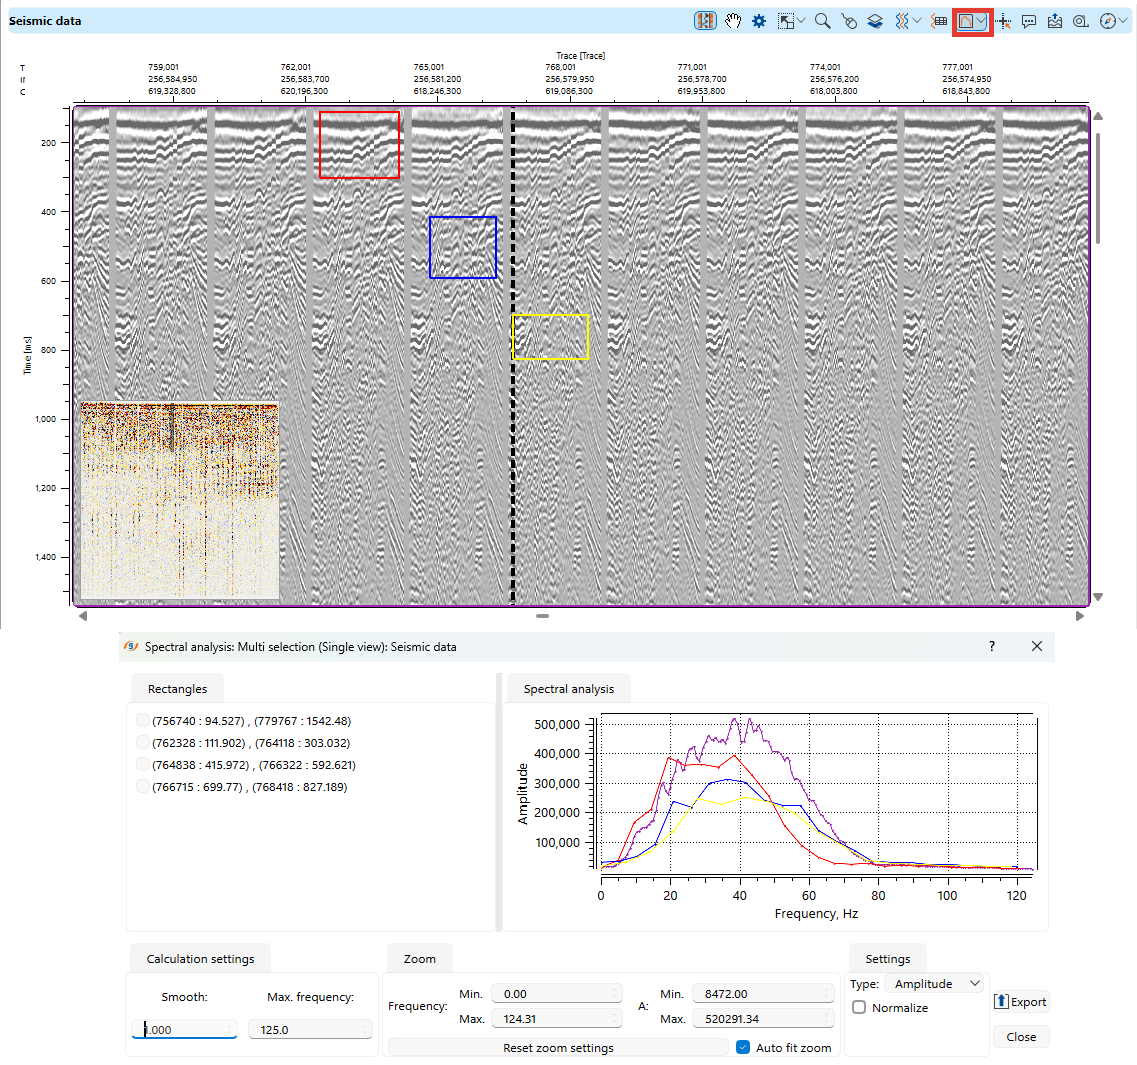
•Activate the Band-Pass Analysis tool at the top of the view
•Select multiple regions of interest within the seismic data using left mouse button
•Each selected region will be analyzed, and its corresponding frequency spectrum will be plotted
Spectral Analysis Panel
Once selections are made, the spectral analysis panel displays:
•The list of selected regions.
•The computed amplitude spectrum for each selection.
•The option to change color, the same color will be highlighted a rectangle on Seismic data view and show spectrum plot
•Options to adjust frequency smoothing and zoom settings.
•Export functionality for saving results.
Calculation Settings
•Smoothing: Adjusts the level of spectral smoothing.
•Max Frequency: Defines the upper limit of the analyzed frequency range.
Zoom & Display Options
•Users can zoom into specific frequency ranges.
•The "Auto fit zoom" feature optimizes the view for better visualization.
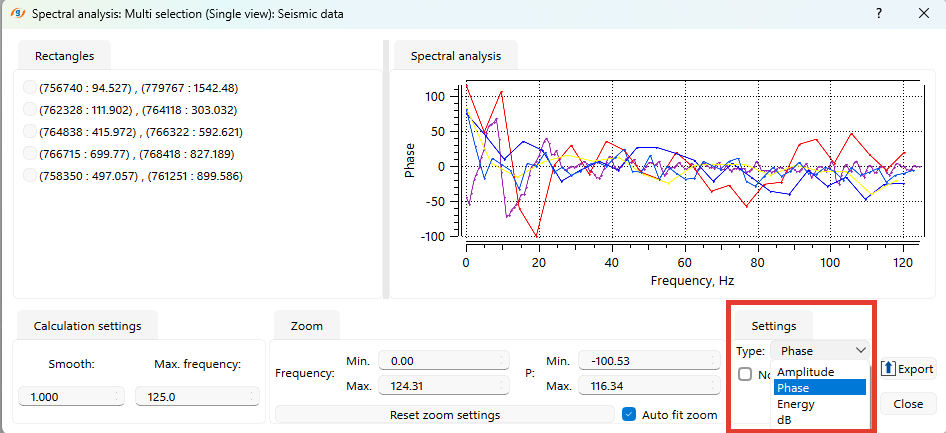
Users can analyze the frequency spectrum using different types of spectral analysis:
•Amplitude: Displays the amplitude of each frequency component.
•Phase: Shows the phase shift of each frequency component.
•Energy: Represents the energy distribution across frequencies.
•dB: Provides a decibel scale representation of spectral content.