Linear noise attenuation
![]()
![]()
This procedure computes linear wave (noise) attenuation in the frequency-wavenumber (FK) domain in the local sliding time-spatial windows. Input seismic gathers transformed from the time spatial (TX) domain to the FK domain. Horizontal waves have infinite apparent velocity and shown as vertical lines in the FK domain. Vertical waves have zero apparent velocity and shown as horizontal lines in the FK domain. This definition uses for attenuate linear waves. This filter module works in FK domain, which represents two dimensional Fourier transform (FT) over time and space, where F is frequency (FT time) and K is wave number (FT space) (Fig.1). The algorithm removes energy from seismic data by applying user-defined polygon in frequency-wave number domain.
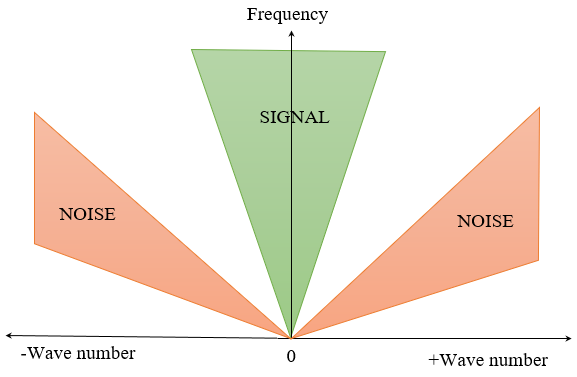
Fig.1 FK domain scheme.
Zones for rejection (reject option is switch on) or saving (reject option is switch off) in the FK domain limited by velocity lines and their slopes must be defined. The slope is apparent velocity in the spatial time (T, X) domain. There is a filter of two velocities (min, max), taper’s bound defined by two mutually exclusive parameters there are frequency and slopes.
![]()
![]()
No actions
![]()
![]()
Input Gather - input seismic gather, NMO-corrected (not strict, but reasonable), any sorting (usually source gather).
![]()
![]()
Trace window (traces) [-1 - all traces] <Traces>
Number of traces for sliding window. This window used for local attenuation. Taper zone between sliding windows is ¼ of trace window.
Time window <ms>
Milliseconds for sliding window. This window used for local attenuation. Taper zone between sliding windows is ¼ of time window:
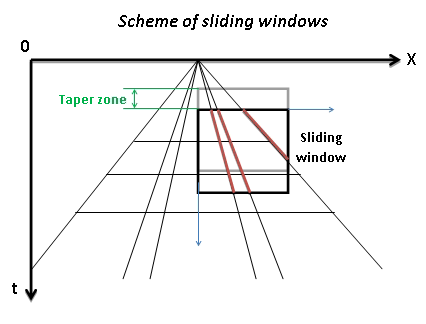
Fig.2 Scheme of sliding window.
Min frequency <Hz>
Minimum frequency for attenuation.
Max frequency <Hz>
Maximum frequency for attenuation.
Min velocity <m/s>
Minimum velocity for attenuation.
Max velocity <m/s>
Maximum velocity for attenuation:
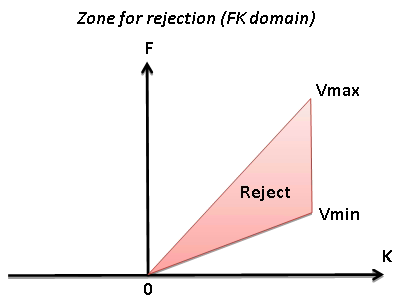
Fig.3 Rejection zone in FK domain.
Coefficient <%>
Coefficient (%) for more intensive attenuation with high values, and less intensive attenuation with low values.
Advanced Mode
Delta offset [0 - auto detect] <meter> - Distance between traces (meters) in the input gather, need to calculate FK spectrum. By default it is -1, it means read offsets from traces headers and calculate delta offset automatically.
Aliasing - Option for exclude aliasing effect:
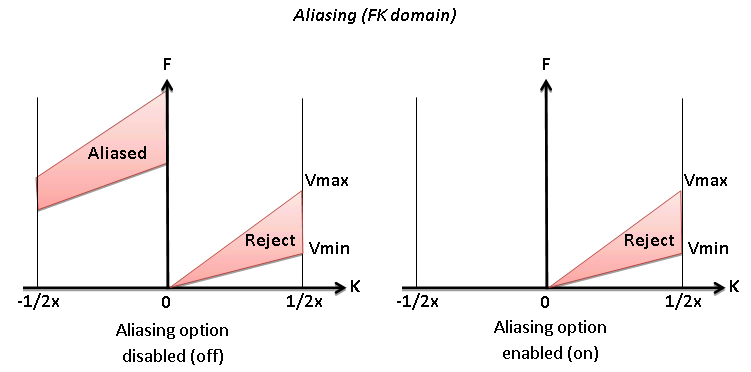
Fig.4 Aliasing in FK domain.
Symmetrical - Option for symmetrical attenuation (positive and negative velocity together):
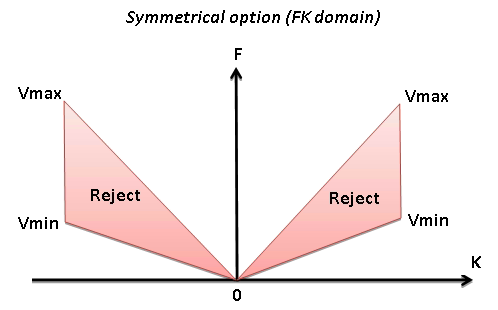
Fig.5 Symmetrical mode in FK domain.
Reject - Option for reject (on) or save (off) data between Vmin and Vmax:
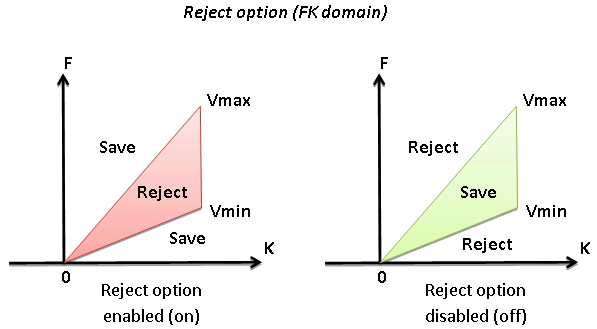
Fig.6 Reject and save modes mode in FK domain.
Taper mode:
Type of taper zone between reject and save zones:
Slopes - Taper defined by slope.
Wavenumber - Taper defined by wave number.
Frequency - Taper defined by frequency.
Min velocity taper <%> - Percent of minimum velocity.
Max velocity taper <%> - Percent of maximum velocity.
Wave number taper (Number of K) - number of k.
Frequency taper <Hz> - Taper defined by frequency.
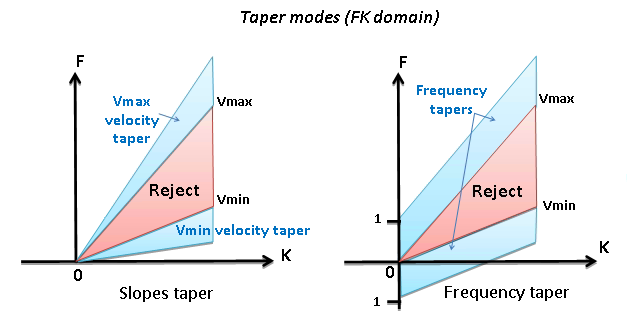
Fig.7 Tapers in FK domain.
![]()
![]()
Skip - switch-off this module (for skipping in the flow).
Auto-connection - module is connected with previous (and next) modules in the workflow by default.
Bad data values option
There are 3 options for corrupted (NaN) samples in trace:
Fix - fix corrupted samples.
Notify - notify and stop calculations.
Continue - continue calculations without fixing.
Calculate difference - perform conventional subtraction input and output gathers (DIFF = IN - OUT), and result is displayed on the difference visual vista.
Number of threads - perform calculation in the multi-thread mode.
![]()
![]()
Output gather - input seismic data minus linear noise (according to the polygon).
![]()
![]()
A test seismic data set is the Poland 2D (land) line, you Poland 2D line that is accessible on the internet free or it is also included to the g-Platform installation (C: \Program Files (x86)\Geomage \gPlatform \demodata\ Poland_2D_Vibroseis_LINE_01).
The input gather should be NMO-corrected. Options “Reject” + “Symmetrical” produces more acceptable result. Define frequency range which includes only linear waves for attenuation (estimate by spectral analysis). Drag’n’drop velocity lines from procedure “Local FK” to the seismic gather and select “Not Selected Velocity Lines”.
Then you can estimate velocity manually by drawing velocity lines by mouse (see Fig.8) and add values to the min/max velocity fields.
If drag’n’drop “Selected Velocity Lines” you can automatically add velocity values to the parameter field (min/max velocity) by double click on velocity lines (see Fig.9). Selected velocities will be green color.
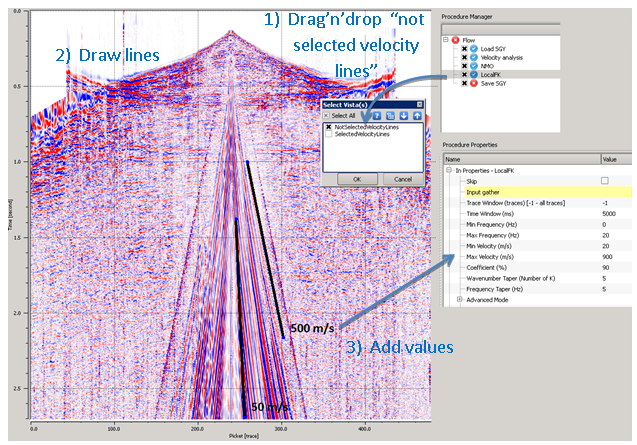
Fig.8 Velocity lines visual mode.
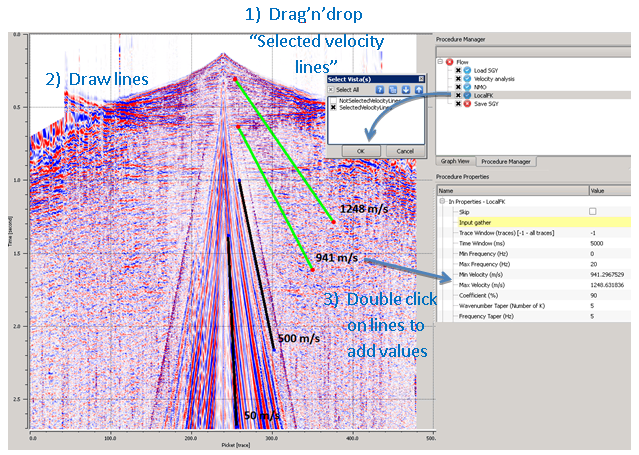
Fig.9 Add velocity values by clicking on visual lines on the window.
An example of the workflow for LNA filtering:
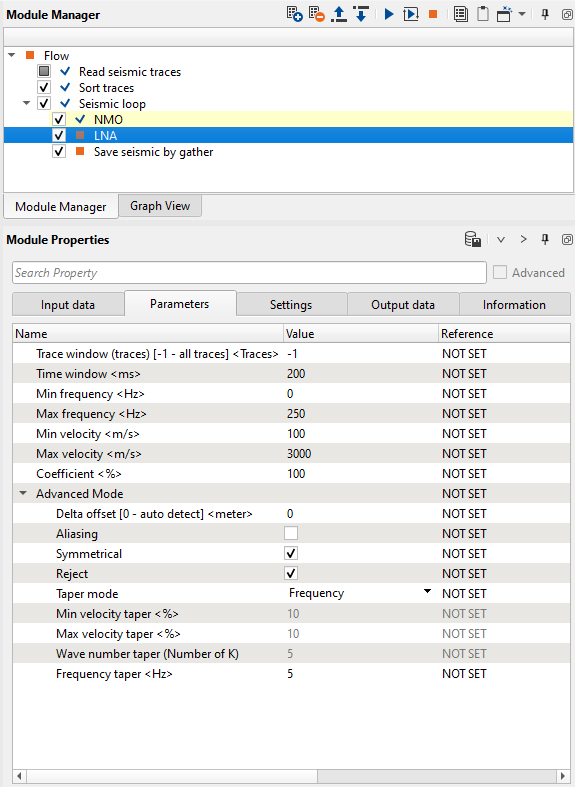
Fig.10 Workflow example.
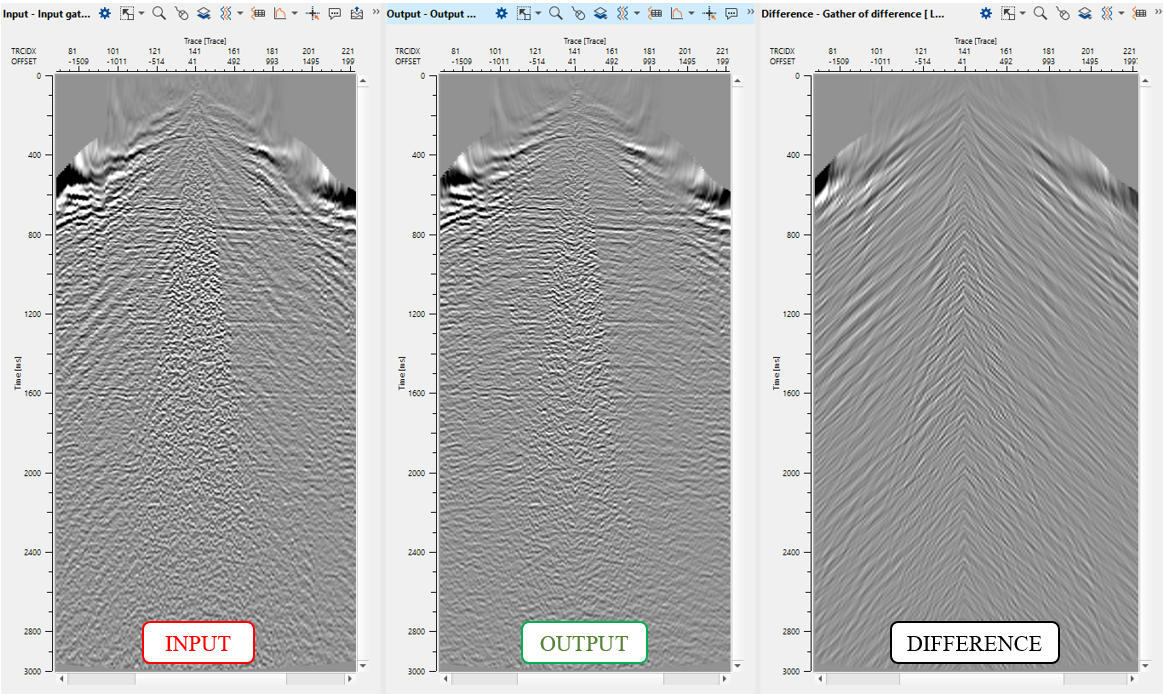
Fig.11 Input gather (left), output (middle) and difference (right).
![]()
![]()
YouTube video lesson, click here to open [VIDEO IN PROCESS...]
![]()
![]()
Yilmaz. O., 1987, Seismic data processing: Society of Exploration Geophysicists
Shettar A., 2019, F-K Filtering for Seismic Data Processing
* * * If you have any questions, please send an e-mail to: support@geomage.com * * *