g-Platform offers many noise attenuation modules. Here in this example, we are going to describe one of the noise attenuation module where we can see how we can test the parameters and visualize the Input, Output and Difference.
Module name 2D Radial trace denoise
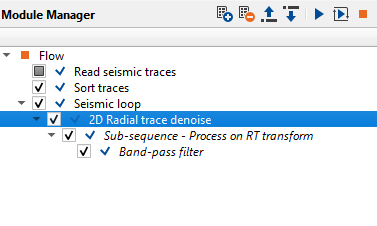
We have added 2D Radial trace denoise module inside the Seismic loop. To do the parameter testing, we have to two ways to display the vista items.
1. Right click on Seismic loop--> Vista Groups--> All groups--> In new window.
2. Click on the "Add module views in the current window" ![]() icon
icon
(far right hand side of the Module Manager title ![]() )
)
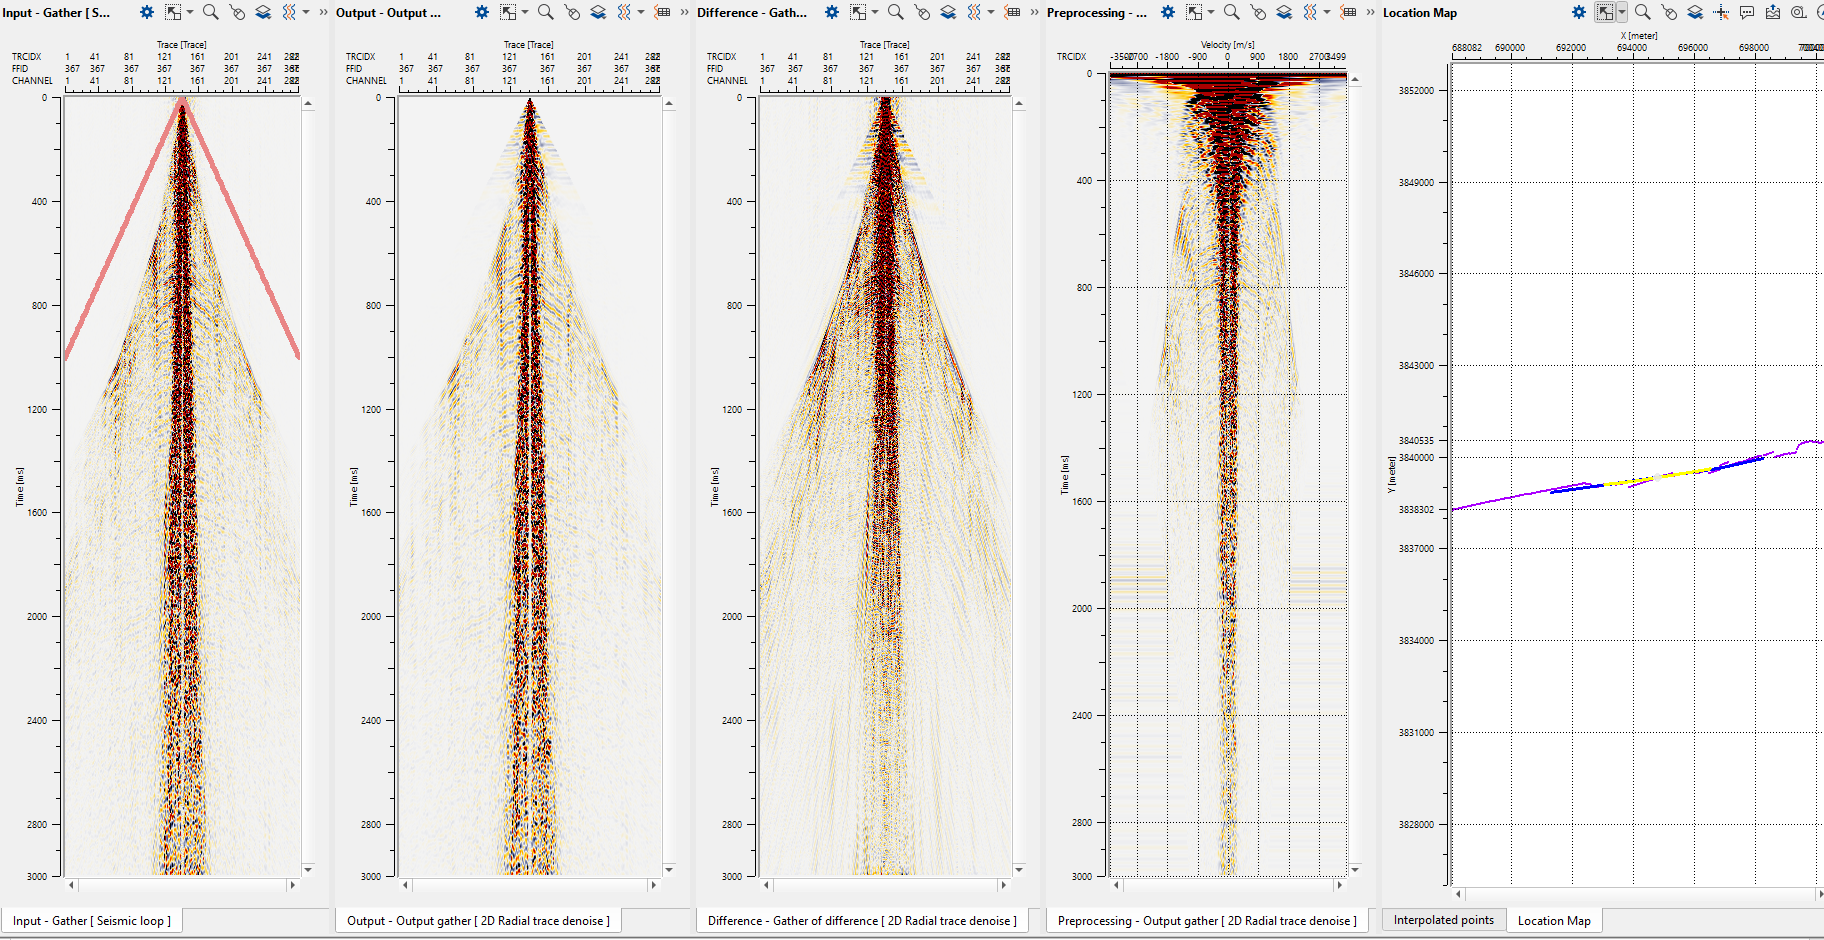
Once we generated the Vista items of Seismic loop using any one of the above mentioned methods, it will displays the Input - Gather, Location Map, Interpolated points (Ignore for the time being) like as shown below.
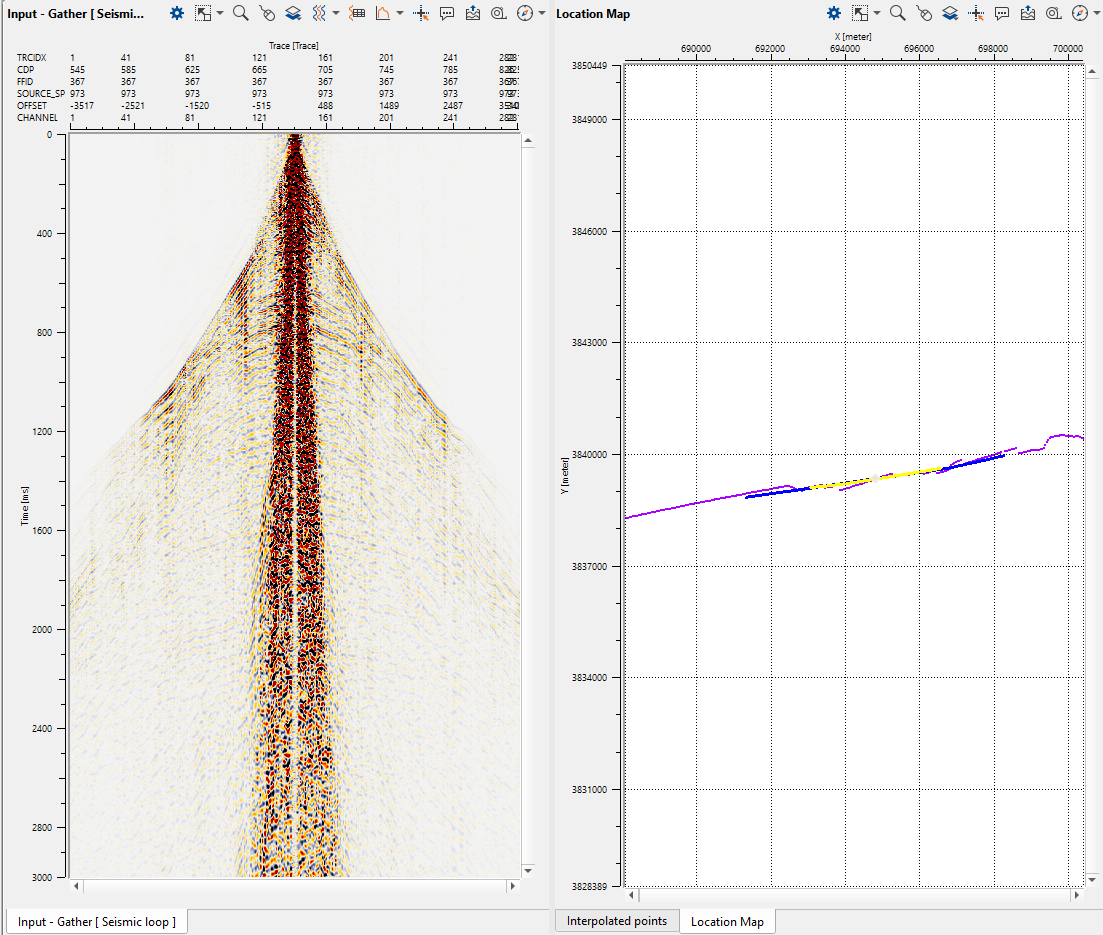
Here the user can click on anywhere (we mean along the line) on the Location Map and select random gather (be it shot/receiver/cmp depending on the sorting at Sort traces) and the corresponding gather will display in the Input-Gather window.
Inside the Seismic loop, we have 2D Radial trace denoise module. Adjust the parameter according to the user requirement and click on the ![]() icon. It will display the vista items of Input, Output, Difference & Preprocessing - Output gather of 2D Radial trace denoise module.
icon. It will display the vista items of Input, Output, Difference & Preprocessing - Output gather of 2D Radial trace denoise module.
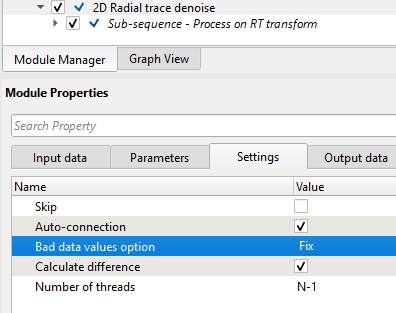
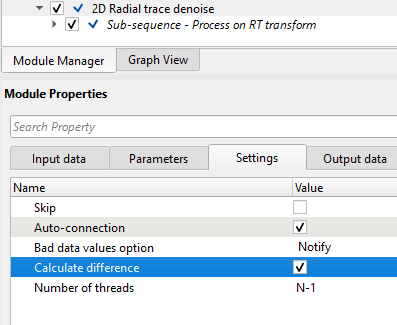
Similarly the user can generate the Input/Output/Difference displays for any module. However the user should know that the Difference display won't start automatically for a reason. We turned OFF this option in the Settings tab of Module Properties since it will take some time to generate during the production phase. If the user wants to generate the difference display during the testing phase, they can turn ON from the Settings tab of that particular module as shown below.
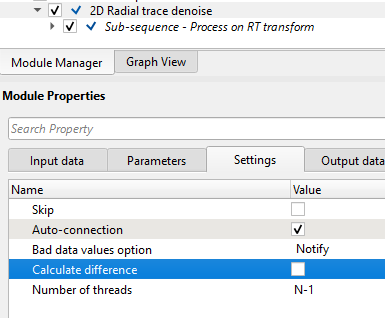
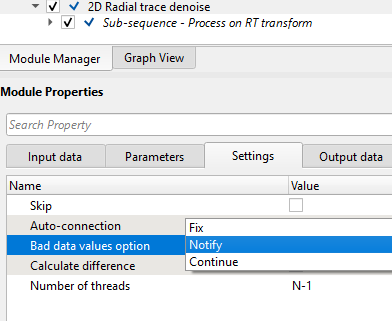
Also we would like to mention about "Bad data values option" in Settings tab of Module Properties. Whenever there is a NaN (Not a Number) in the data and if the user encounters an error message then the user should check this option and choose the relevant option among these 3 options available.