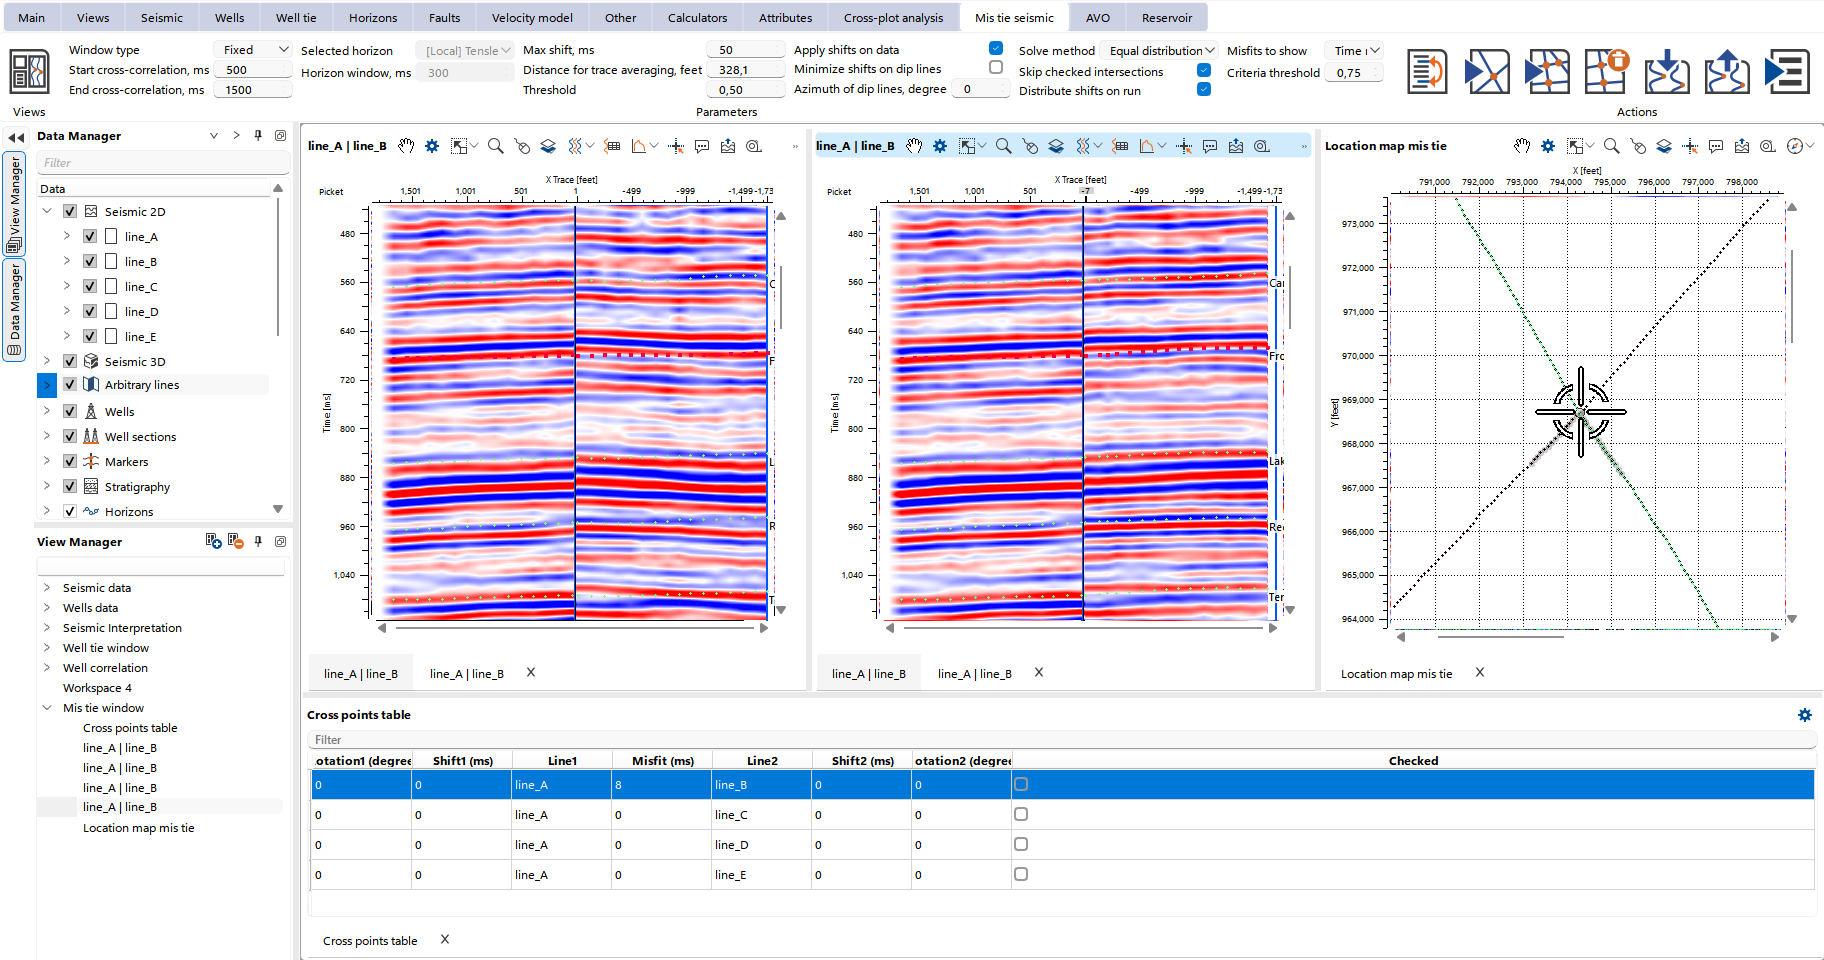
Arrange your workspace as desired, ensuring relevant views (e.g., seismic sections, location maps) are visible.
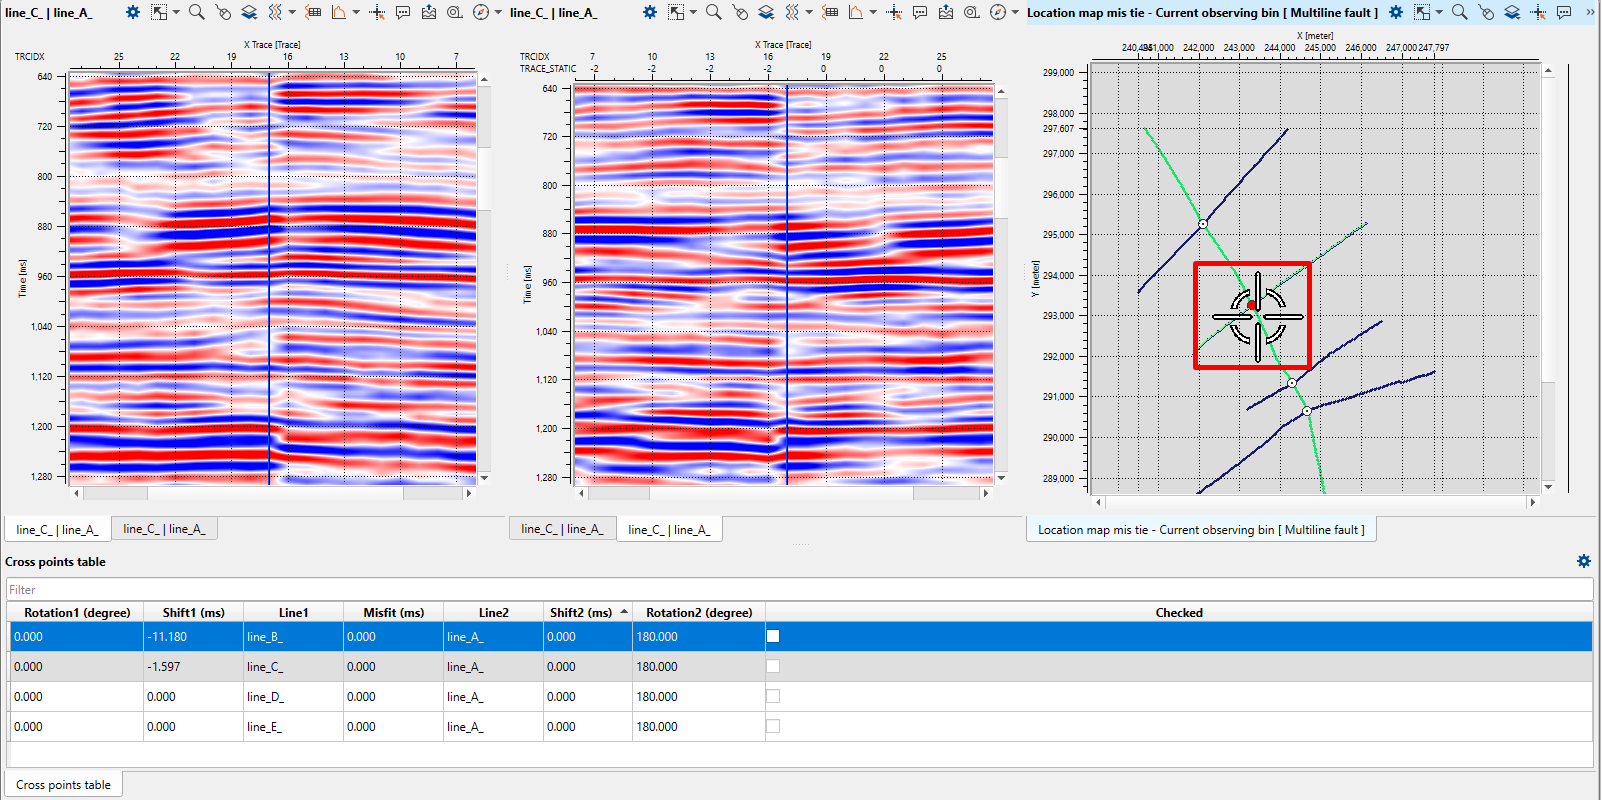
Use the left mouse button to drag the seismic section up or down, applying shifts to specific parts of the section. These shifts will be recorded in the Cross Points Table.
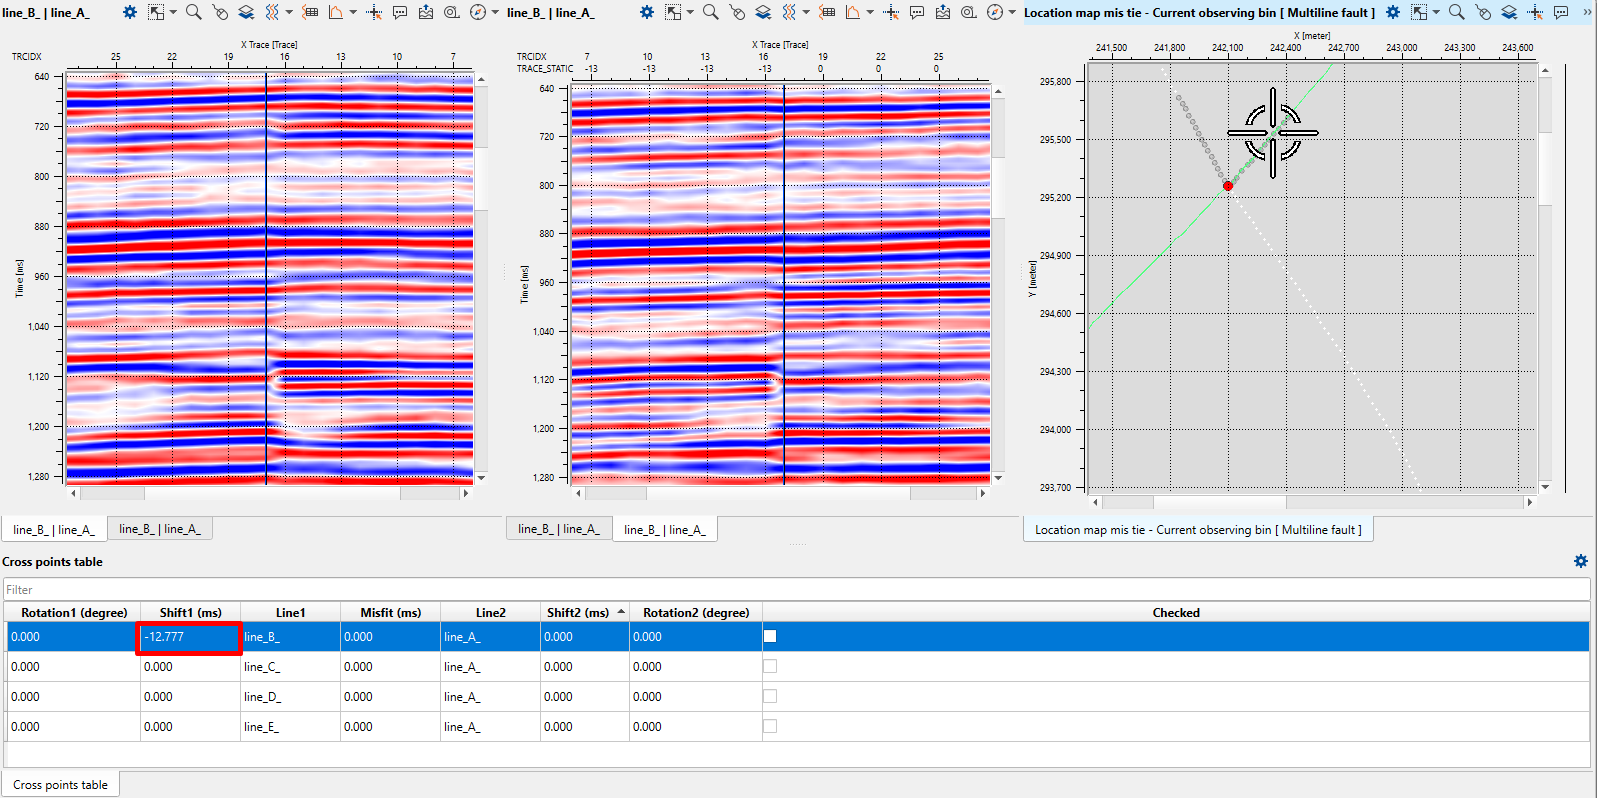
To clear shift click by right mouse button on the section.
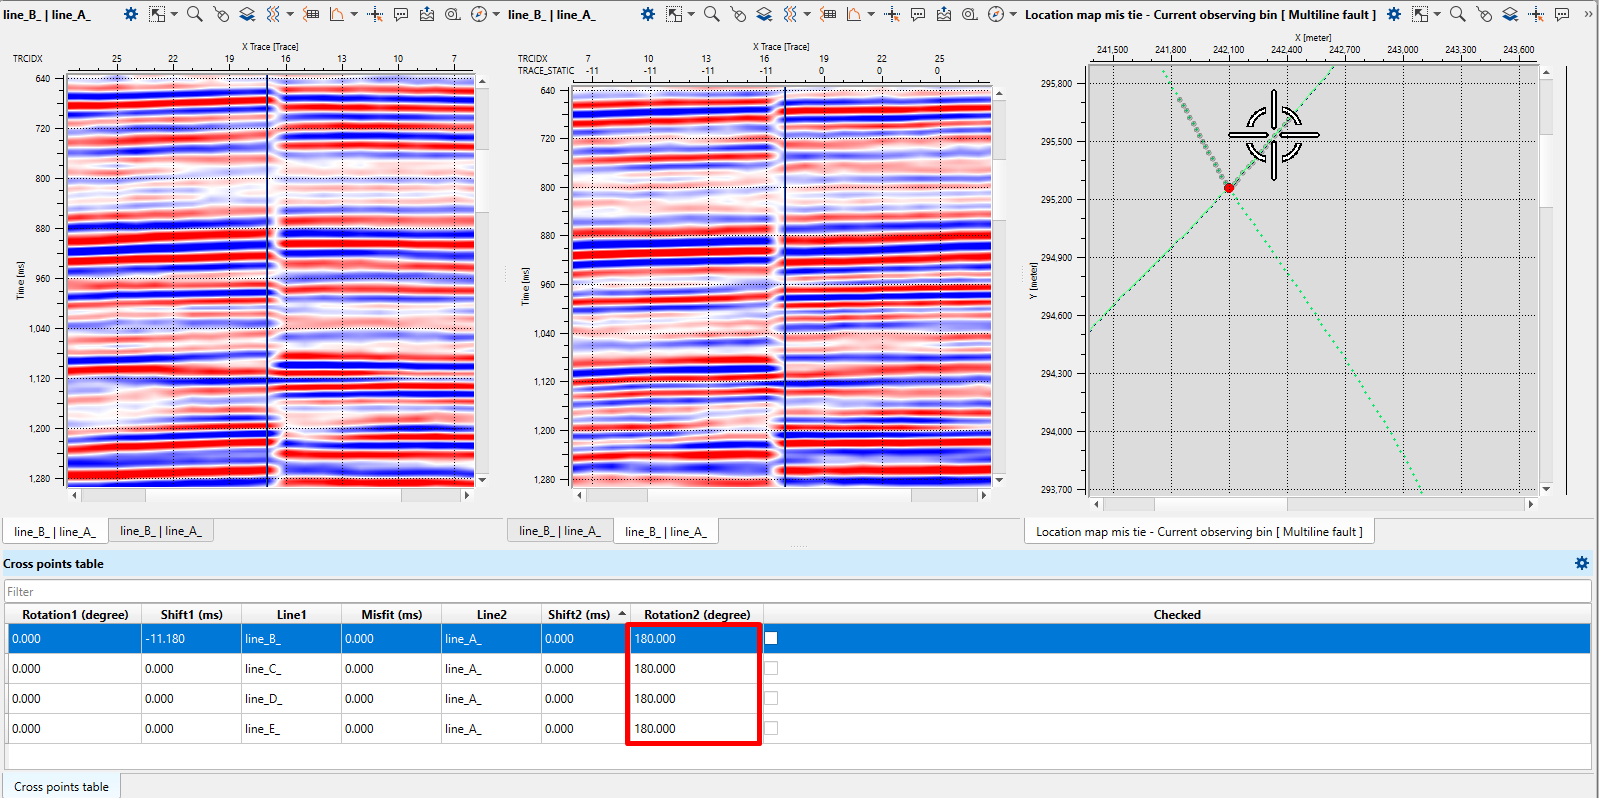
To add phase rotation put the value to the cross point table
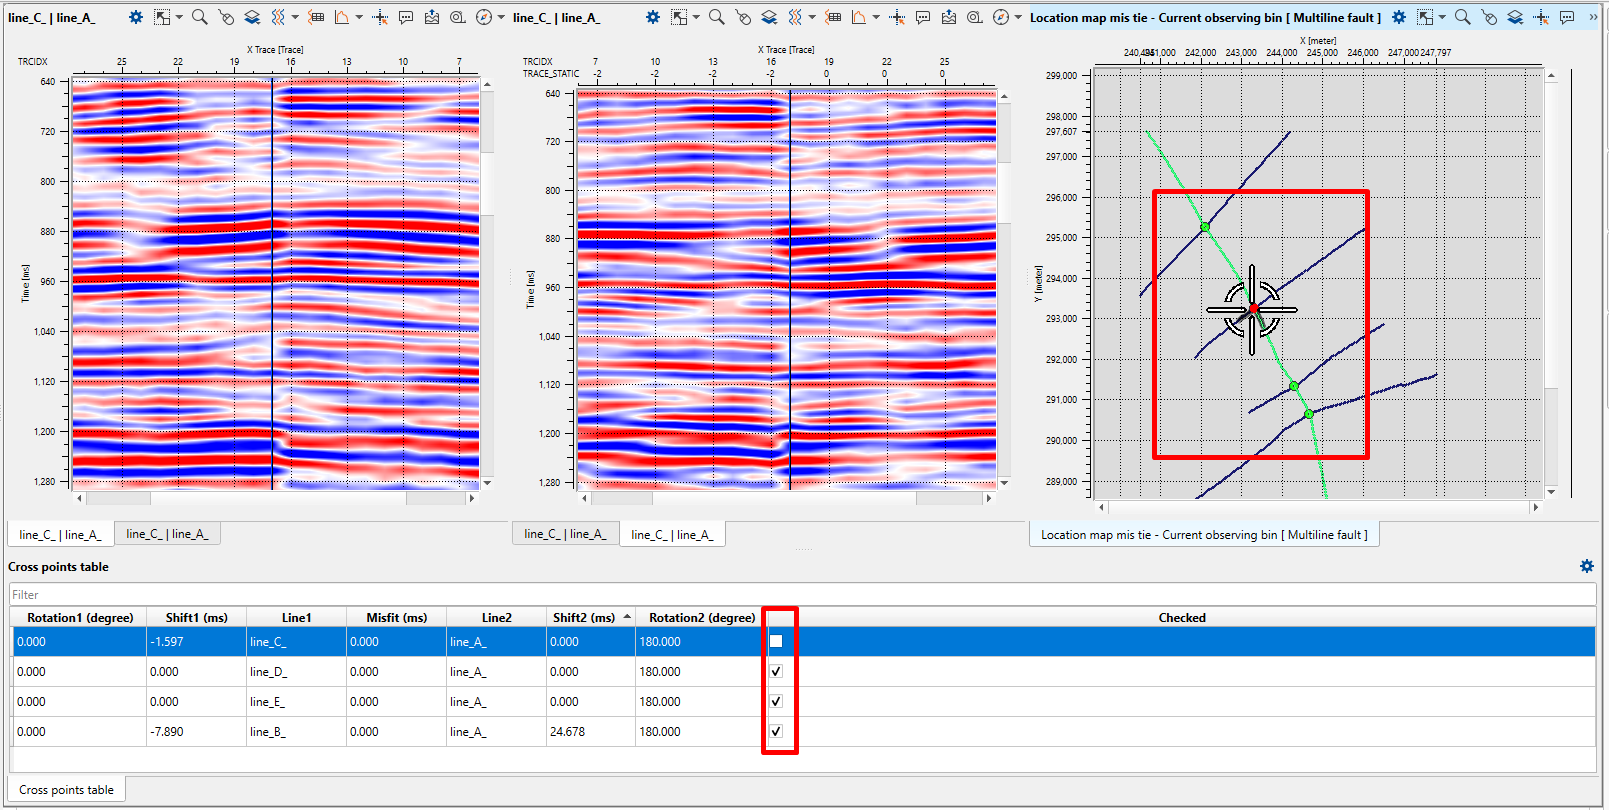
Once adjustments are complete, move to the next intersection via the location map or by selecting the corresponding entry in the Cross Points Table.
After finishing work on an intersection, you can mark it as "checked" by double-clicking the relevant box. Checked intersections will be highlighted in green on the map.
Automatic Mis-tie Correction: In addition to manual corrections, automatic mis-tie correction through time-shift calculation is available. This method leverages cross-correlation and requires specific settings input in the Mis-tie Seismic toolbar:
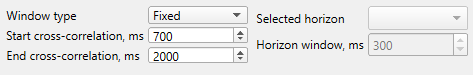
1) Cross-correlation settings:
•Choose between a fixed time window or a window centered around a particular horizon. If a horizon is selected, it will form the center of the specified window.
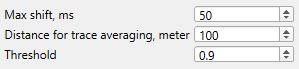
2) Time-shift parameters:
•Set the maximum allowable time shift.
•Specify the distance for trace averaging, which will be used for comparison.
•Define the threshold for adding traces from the specified distance to the average.
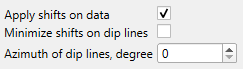
3) Applying shifts:
•Enable shifts to be applied to the seismic data.
•Optionally, activate shift minimization for lines with a specific azimuth, useful in cases involving dipping horizons where azimuth alignment can improve results.
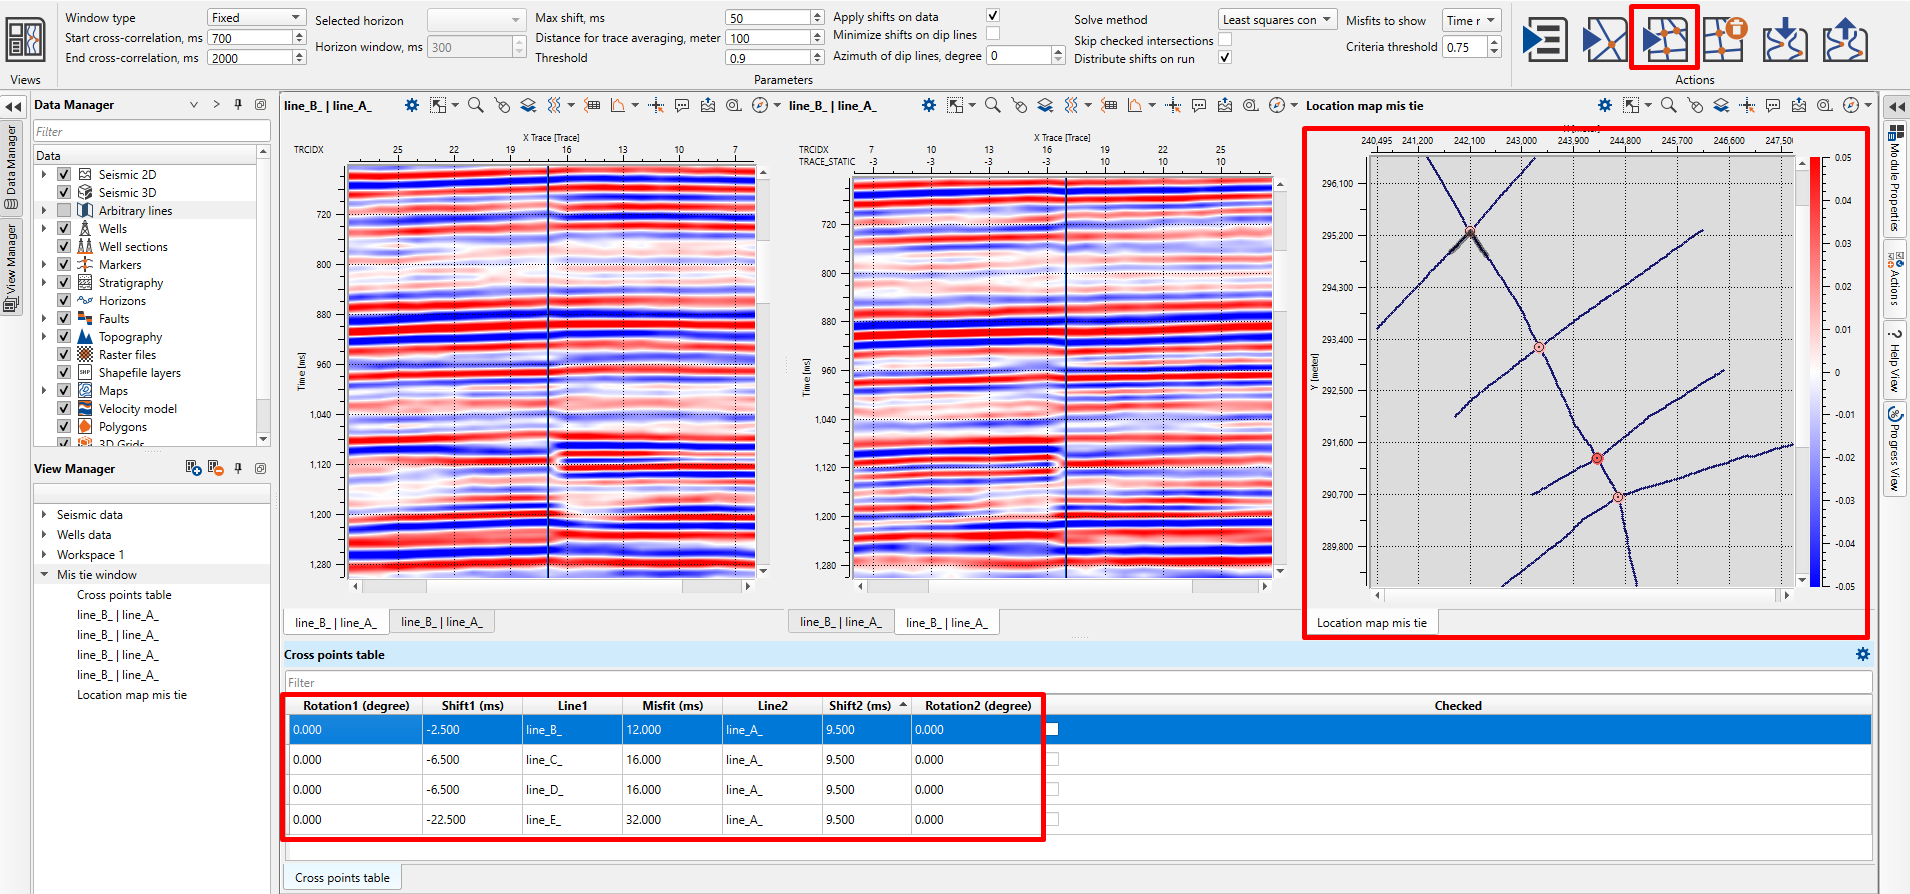
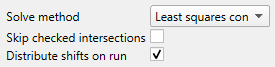
4) Shift calculation methods: Select from various methods:
•Equal distribution: Splits mis-tie values evenly between intersecting lines.
•Least squares: Minimizes the sum of squared mis-tie corrections.
•Least squares with constant time: Same as above but with a constraint that the time shift is constant for each line.
•Least squares with constant time + phase: Includes phase shifts in the calculation.
Optionally, skip intersections marked as "checked" in the calculations. Also, choose whether to apply shifts directly to the data or just visualize them on the map.
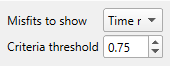
5) Mis-tie visualization:
•Choose whether to visualize mis-ties on the map based on time or phase.
•Set a threshold to halt the binding process once a certain accuracy is achieved.
6) Group priority:
•If multiple seismic groups exist, prioritize them for mis-tie correction using the appropriate button.

You can perform shift calculations on individual intersections or across the entire dataset:

When calculating across all lines, the Cross Points Table will automatically populate with the calculated shift values.
Enable Misfit Points in the properties menu, which will be color-coded based on their mis-tie value, and displayed on the location map.