The 3D Mis-ties Correction tool in g-Space enables the adjustment of seismic datasets for time and phase shifts between intersecting 3D seismic volumes. This correction improves the consistency between datasets, particularly when dealing with different acquisition or processing workflows.
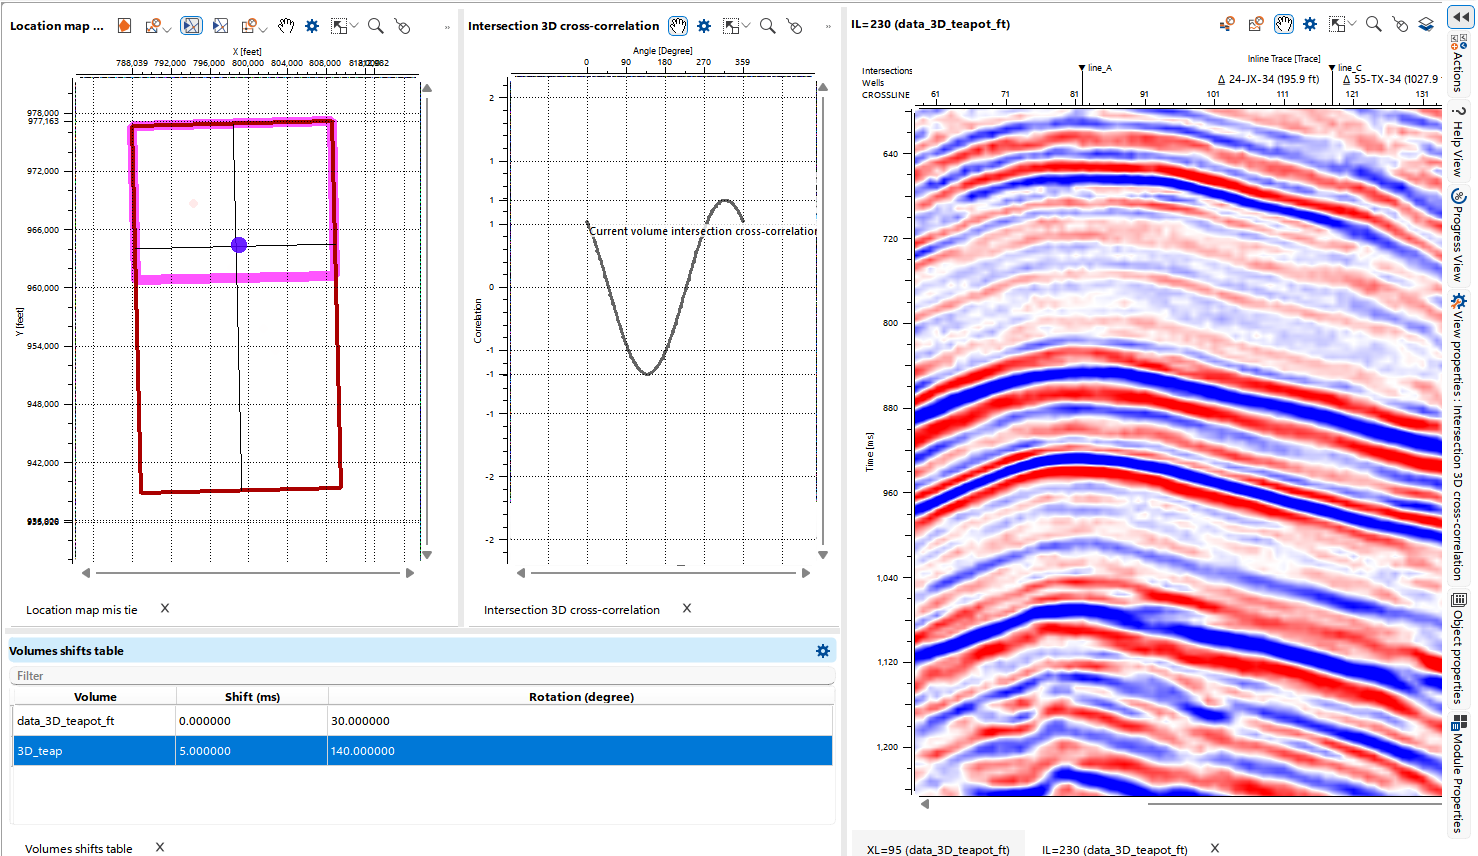
To begin, configure your workspace as demonstrated in the image below, ensuring that the Location map, the Volumes shifts table and the Intersection 3D cross-correlation views are visible.
In the image below, the Location map shows two volumes in different colors. It is also convenient to view the results interactively in the section view.
If your project includes multiple seismic processing groups, the priority for applying corrections can be adjusted using the Seismic Group Priority button

Calculate the intersections of volumes by clicking the Calculate volumes intersection button  in the bar, new objects will appear in Object(s)
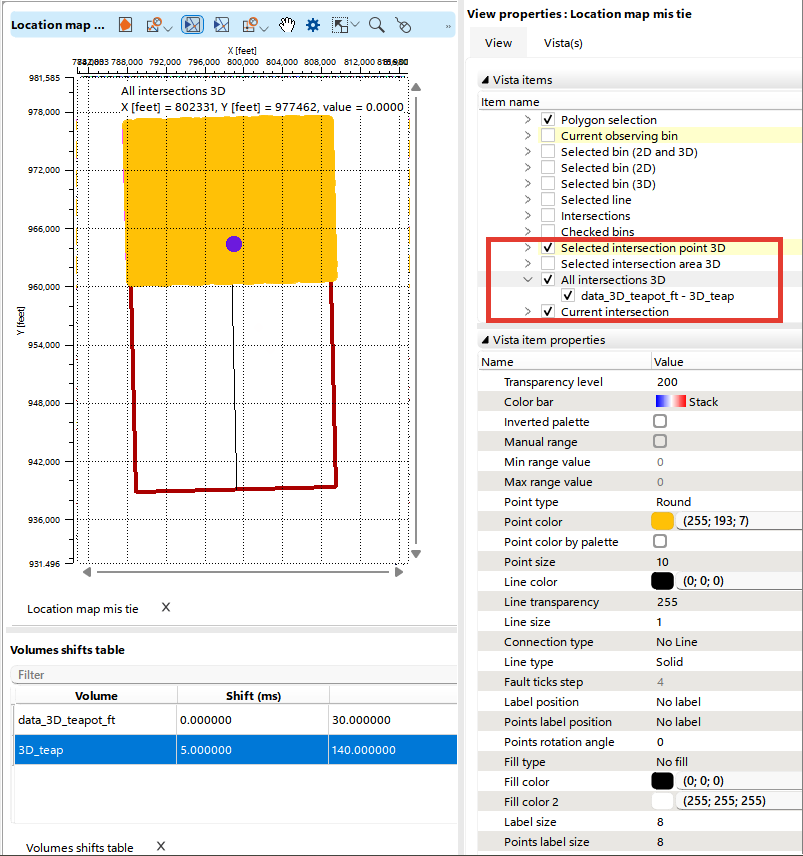
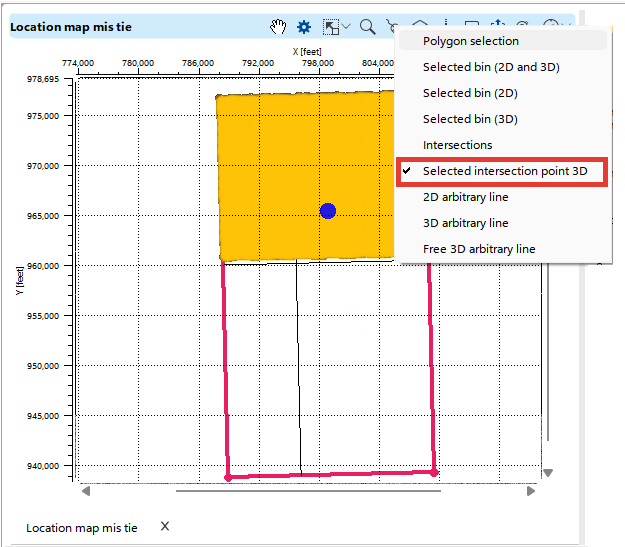
Select the intersection point 3D, at this point the mis-ties and cross-correlation will be calculated.
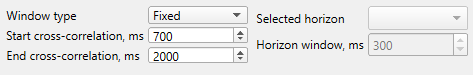
Choose between a fixed time window or a window centered around a particular horizon. If a horizon is selected, it will form the center of the specified window.
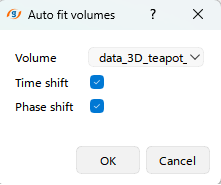
Then click Auto fit volume button in the bar and in the pop-up window that appears, select the volume relative to which the correction and the time, phase, or both variants of the residuals will be calculated.
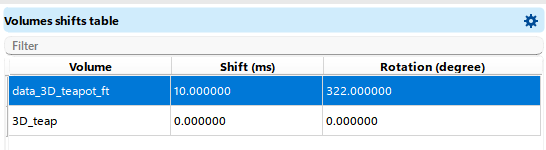
The calculated shifts will appear in the Volumes shift table.
If necessary, you can enter the time and phase shifts into the table manually.
Once the calculation is done, the shifts will be applied to the seismic volume.
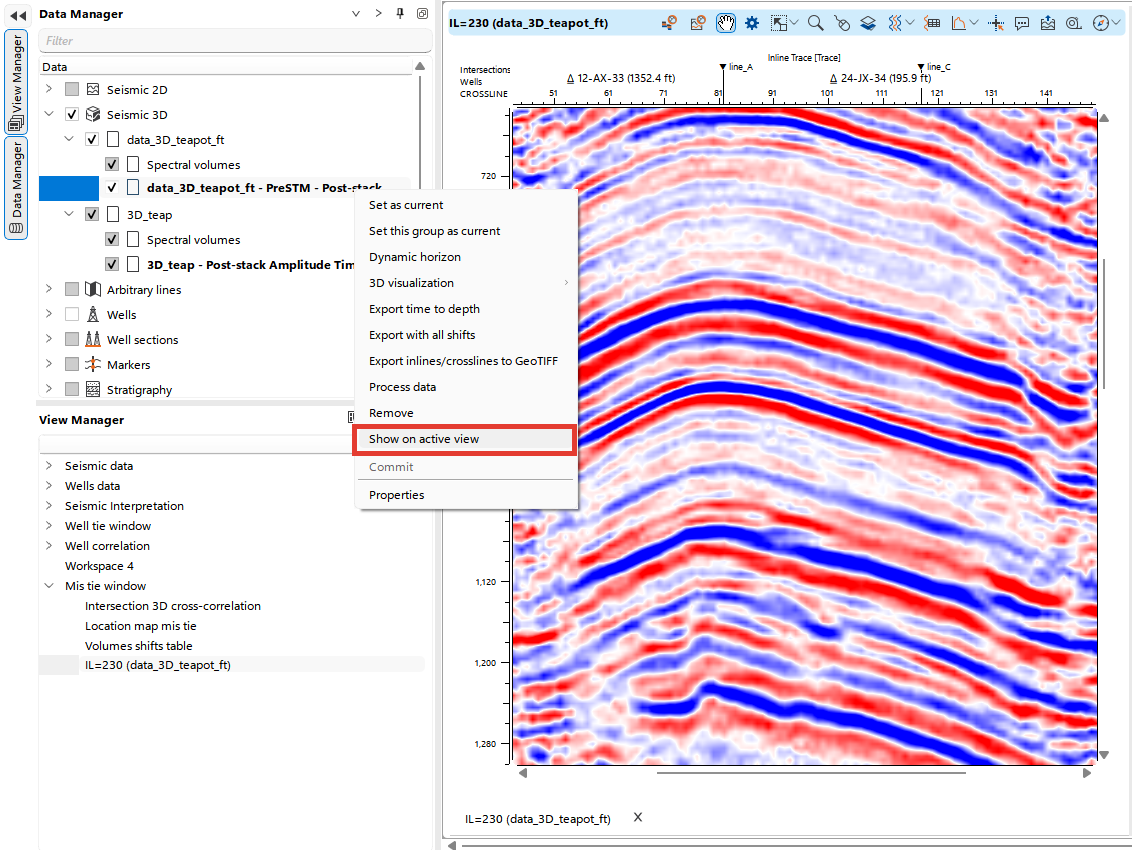
To efficiently visualize the results, you can use the Show in Active Window function available in the Data Manager for seismic data. This option allows seamless display of the selected seismic data within the active visualization window. For more detailed information on how to display and work with seismic data, refer to the Seismic Data Visualization chapter in this manual.