Data Manager
Data manager provides access to any data object from the project database and allows to control its creation, update, delete, visibility and operations
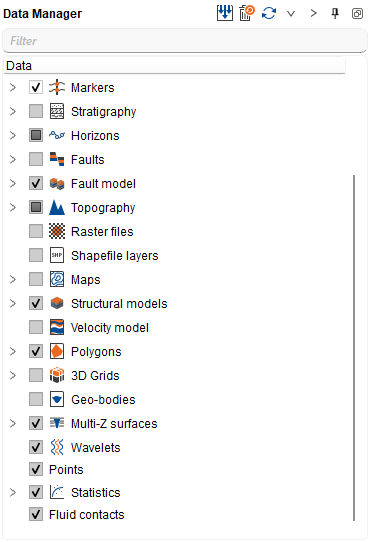
Icons and visibility
The checkbox and icon next to each data object show whether it is – or can be – displayed in the active view:
- Checkbox checked – the data is displayed in the active view window.
- Transparent icon – the data can be visualized in the active window.
- Gray icon – the data cannot be visualized in the active window type.
- Expand arrow (>) – click to expand or collapse nested data categories.
Two buttons at the top of the panel change visibility for many objects at once. Show all and Hide all are placed to the left of Sync visibility: Show all ticks every object that can be displayed in the active view, and Hide all clears the checkbox of every object currently shown there, hiding them all at once.
Both buttons act on the active view only – with a 3D view active they affect that 3D view, with a Location map active that Location map. They change visibility only: the objects, their data, their availability and the folder structure are not touched, and objects that cannot be visualized in the active window type (gray icon) are not affected. The Data Manager checkboxes and the Visual Settings panel are updated immediately.
Use the Filter field at the top of the panel to quickly find objects or folders by name and simplify navigation in large projects.
Sorting objects by name
Right-click a top-level data category and choose Sort by name to arrange its objects by name. Sorting ignores case and compares runs of digits by value, so numbered names line up as expected: 9-AX-2 comes before 12-AX-11. This option is available for the Wells, Horizons, Maps, Seismic 2D, Seismic 3D, Wavelets and Multi-Z surfaces categories. Sub-folders are listed before individual objects; in the Wells category the All curves and Filters branches remain pinned at the top.
In the Wells category, Sort by name is also available on every well folder and sub-folder: right-click the folder and choose it at the top of the folder command block, which continues with Add folder, Rename, Remove (offered only for an empty folder) and Move to folder. The command rearranges only the direct contents of that folder, so the other folders and the rest of the tree keep their order, and each sub-folder is sorted separately when the command is run on it. The folders that group LAS files and curves inside an individual well have no folder commands, so Sort by name is not offered there.
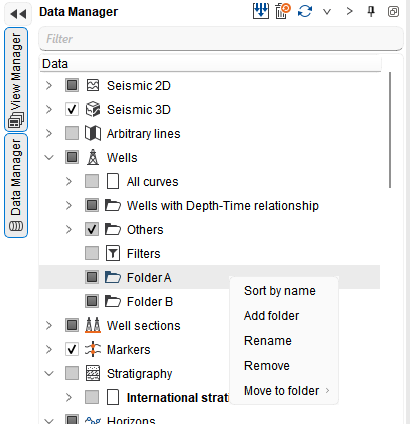
Arranging objects manually
Objects can also be arranged by hand. Drag an object or folder and drop it at another position inside its own data category, or drop it on a folder of that category to move it into that folder. An object cannot be dragged from one data category into another.
In the Wells category the All curves and Filters branches always stay at the top of the list: they cannot be dragged, and nothing can be dropped above them or on the Wells category row itself. Drop wells and well folders below Filters.
A folder added with Add folder appears at the end of the list it is created in, and the objects already present keep their positions.
Clearing project data
When you choose a root-level clear command that deletes project data, g-Space asks for confirmation before removing it. The question names the object type and count, for example, "Remove all 34 horizons?" or "Remove 1 horizon?". Decline the prompt to keep the data. When the count is zero, the command removes nothing.
The counted confirmation applies to 2D lines, 3D seismic volumes, wells, checkshots, LAS files, well sections, marker sets, horizons, faults, raster files, shape layers, arbitrary lines, maps, velocity models, polygon sets, stratigraphic charts, 3D grids, geo-bodies, multi-Z surfaces and wavelets. Clear 3D visualization cache runs without a confirmation because the cache can be regenerated.
Right-clicking an individual 3D seismic volume, spectral volume, map, arbitrary line, raster, shape layer, collection of fault contact lines or fault block and choosing Remove or Delete prompts you to confirm the specific item before it is removed. Removing a seismic geometry warns that all volumes in the geometry will be removed. Clear maps on a map type folder asks before removing every map of that type. Removing a well section template also has its own confirmation. Declining any prompt leaves the data in place.
When you select multiple 3D seismic volumes, raster files, shape layers, arbitrary lines or maps and choose Remove, g-Space shows one confirmation with the number of selected items.
Data categories
Data manager contains predefined categories for specific data types:
Seismic 2D - contains any type of 2D seismic data such as post-stack, pre-stack, velocity, attributes etc.
Right mouse button on the icon allows to:
- Add new line
- Convert ASCII data to lines
- Clear lines
- Export all lines to CPS-3 line file
- Export all time lines to depth
- Export all time lines with shifts
- Receive lines
- Commit lines
- Add folder
Seismic 3D - contains any type of seismic 3D data such as post-stack, pre-stack, velocity, attributes etc.
Right mouse button on the icon allows to:
- Add new volume
- Convert ASCII data to volume
- Clear volumes
- Clear 3D visualization cache
- Receive volumes
- Commit volumes
- Add folder
Sections - each 3D survey (volume geometry) has a Sections folder that stores individual inline (IL) and crossline (XL) sections and time or depth slices created from a volume of that survey. The folder always contains two automatic entries, Selected Inline <number> and Selected Crossline <number>, whose numbers follow the currently selected inline and crossline; while nothing of that survey is selected they show its centre lines. These two entries have no context menu commands and do not react to double-click, but each of them has a working checkbox: select or clear it to show or hide that line on the Location map. Inline and crossline sections added with Add section... are listed as IL <number> and XL <number>.
Right mouse button on the Sections folder allows to:
- Add section... - choose Inline or Crossline and enter a line number; the survey centre line is the default. If a volume is available, you can instead choose Time slice or Depth slice, according to the volume's domain, and enter a time or depth.
Right mouse button on an individual added section (IL <number> or XL <number>) allows to:
- Visualize - display that inline or crossline in the seismic views
- Remove
Double-click an added inline or crossline section to visualize it.
A slice appears under Sections as Time or Depth followed by its value and unit. Select its checkbox to display it on the Location map; clear it to hide it. Right-click the slice for Recalculate or Remove.
Save the project with a slice visible in at least one view to store its current time or depth, source reference and full amplitude raster, along with its visibility and display settings. The raster reappears at the saved level after reopening, even if the source volume or a 3D visualization cache is unavailable; opening the project does not reread the volume or extract another slice. A 3D visualization cache is not required to create or save the slice. Each slice stores only its own level, not adjacent slices, and each stored raster adds approximately four bytes per inline/crossline cell to the project. A slice hidden in all views remains in Sections, but its raster is not saved while it is hidden.
If the source volume is unavailable or re-imported, or its datum or static shift changes, the slice continues to show its stored raster. Its row in the Data Manager turns red and its tooltip explains why the raster may be outdated. Restore a readable source if needed, then choose Recalculate to update it; opening the project does not recalculate automatically.
Arbitrary lines - contains all seismic arbitrary lines created in g-Space
Right mouse button on the icon allows to:
- Add arbitrary line
- Clear arbitrary lines
- Add folder
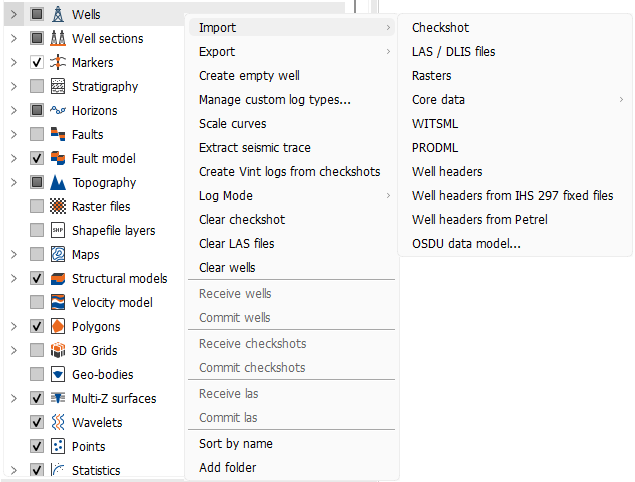
Wells - contains any type of well data
Right mouse button on the icon allows to:
- Import > Checkshot
- Import > LAS / DLIS files
- Import > Rasters
- Import > Core data
- Import > WITSML
- Import > PRODML
- Import > Well headers
- Import > Well headers from IHS 297 fixed files
- Import > Well headers from Petrel
- Import > OSDU data model...
- Export > Wellheads
- Export > Inclinometry
- Export > Checkshot
- Export > LAS
- Create empty well
- Manage custom log types...
- Scale curves
- Extract seismic trace
- Create Vint logs from checkshots
- Log Mode > Curves or LAS files
- Clear checkshot
- Clear LAS files
- Clear wells
- Receive wells
- Commit wells
- Receive checkshots
- Commit checkshots
- Receive las
- Commit las
- Sort by name
- Add folder
Well sections - contains all well sections created in g-Space
Right mouse button on the icon allows to:
- Add well section
- Clear well sections
- Add folder
Markers - contains well marker data with other attributes
Right mouse button on the icon allows to:
- Add marker set
- Clear
- Receive markers
- Commit markers
- Add folder
Stratigraphy - contains the stratigraphic data
Right mouse button on the icon allows to:
- Load from XML
- Load default
- Clear
- Add folder
Horizons - contains seismic picking
Right-click the Horizons category to:
- Add new horizon
- Clear horizons
Right-click the Time or Depth node and choose Create thickness maps. On the Depth node, you can also choose Create isopach maps. These commands are available when the selected domain contains at least two horizons.
- Receive horizons
- Commit horizons
Faults - contains fault picking
Right mouse button on the icon allows to:
- Add new fault
- Clear faults
- Set meshing mode to Sticks or Surfaces
- Export faults
- Receive faults
- Commit faults
Topography - contains internal (from seismic headers) and external (from other sources) topography
Right mouse button on the icon allows to:
- Add folder
Raster files - contains all image files loaded in g-Space
Right mouse button on the icon allows to:
- Add raster files
- Add folder
Shapefile layers - contains loaded shapes and cultural data
Right mouse button on the icon allows to:
- Add shape files
- Load cultural points from text file
- Load custom points from text file
- Add folder
Maps - contains all grids loaded externally and generated by running velocity model.
Maps are separated by types:
- Depth maps
- Velocity maps
- Calculated maps
- Time maps
- Attribute maps
- Imported maps
- Spectral decomposition maps
- Property maps
- Isochore maps
- Isopach maps
- Isochron maps
Right mouse button on the icon allows to:
- Clear maps
- Add folder
Right mouse button on type folder allows to:
- Remove
- Load from text file
- Load from CPS-3 grid file
- Load from ZMap grid file
Velocity model - contains models created in g-Space
Right mouse button on the icon allows to:
- Add velocity model
- Import velocity model
- Clear
- Add folder
Polygons - contains polygons created in g-Space
Right-click the Polygons category to:
- Add polygon
- Import > Import polygons from CPS-3 line file
- Import > Import polygons from DXF file
- Export > Export all polygons to CPS-3 line file
- Export > Export all polygons to shapefile
- Export > Export all polygons to DXF file
- Clear
- Receive polygons
- Commit polygons
- Add folder
3D Grids - contains 3D grids
Right mouse button on the icon allows to:
- Create new grid
- Clear
- Add folder
Geo-bodies - contains created geobodies
Right mouse button on the icon allows to:
- Load from file
- Clear
- Add folder