Velocity model workflow
The Velocity Modeling in g-Space allows users to create and refine velocity models interactively, utilizing /// data.
In this guide, we will explore the various tools available under Velocity Modeling using the /// from the Demo project.
Subscribe to our channel and watch the video on how to build a velocity model in g-Space on YouTube
Grid maps can be created in g-Space by converting horizons to time grids or running velocity model which stores all results in Maps folder in Data Manager
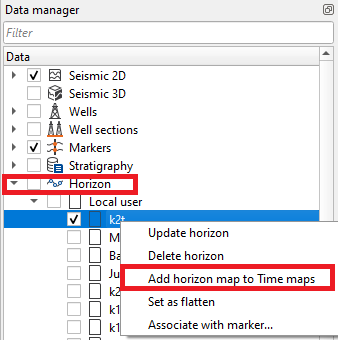
To convert horizon to time grid press Right Click Mouse on horizon to convert on Horizon icon in Data Manager and choose Add horizon to Time Maps
The Data Manager for velocity models in g-Space has a hierarchical structure to manage different velocity model types and their associated data. Here’s a breakdown of the structure as shown in the image:
- Velocity Model: This is the top-level category where all the velocity models are organized.
- Model name: This section holds data related to the specific velocity model.
Displaying model layers in depth sections
The depth maps of the active velocity model (the model set as default in the Data Manager) can be displayed on depth-domain seismic sections: 2D Line, 3D Inline, 3D Crossline and Arbitrary Line. In the view they appear as Depth interval maps projection and Depth average maps projection objects. Each selected map is drawn as a line at its corresponding depth along the section.
Use the check boxes in the Data Manager to control what is shown. Under Skeleton > Depth, select the check box for - by interval velocity or - by average velocity to draw all maps in that branch on the active depth section, or select an individual map's check box to draw that map. Clear a check box to hide the corresponding lines. Where a map has no values, its line is interrupted.
Displaying model time maps in time sections
The time maps of the active velocity model can also be displayed on time-domain seismic sections: 2D line, 3D inline, 3D crossline and Arbitrary line. In the view they are listed as the Velocity model time maps projection object, and each map is drawn as a line at the times it holds along the section.
Under Skeleton > Time in the Data Manager, select the check box of Time to draw all time maps of the model on the active time section, or select the check box of a single map to draw only that map. Clear a check box to hide the corresponding lines. Where a map has no values, its line is interrupted instead of being drawn across the gap.
The surfaces of the active velocity model can also be shown in the time and the depth 3D view, where they are collected in the Velocity model folder of the Object(s) tab.