g-Viewer provides a streamlined and unified interface for visualizing essential seismic data. It includes a wide range of features, organized neatly into various windows. In this section, we will provide a brief overview of the different windows and their functionalities.
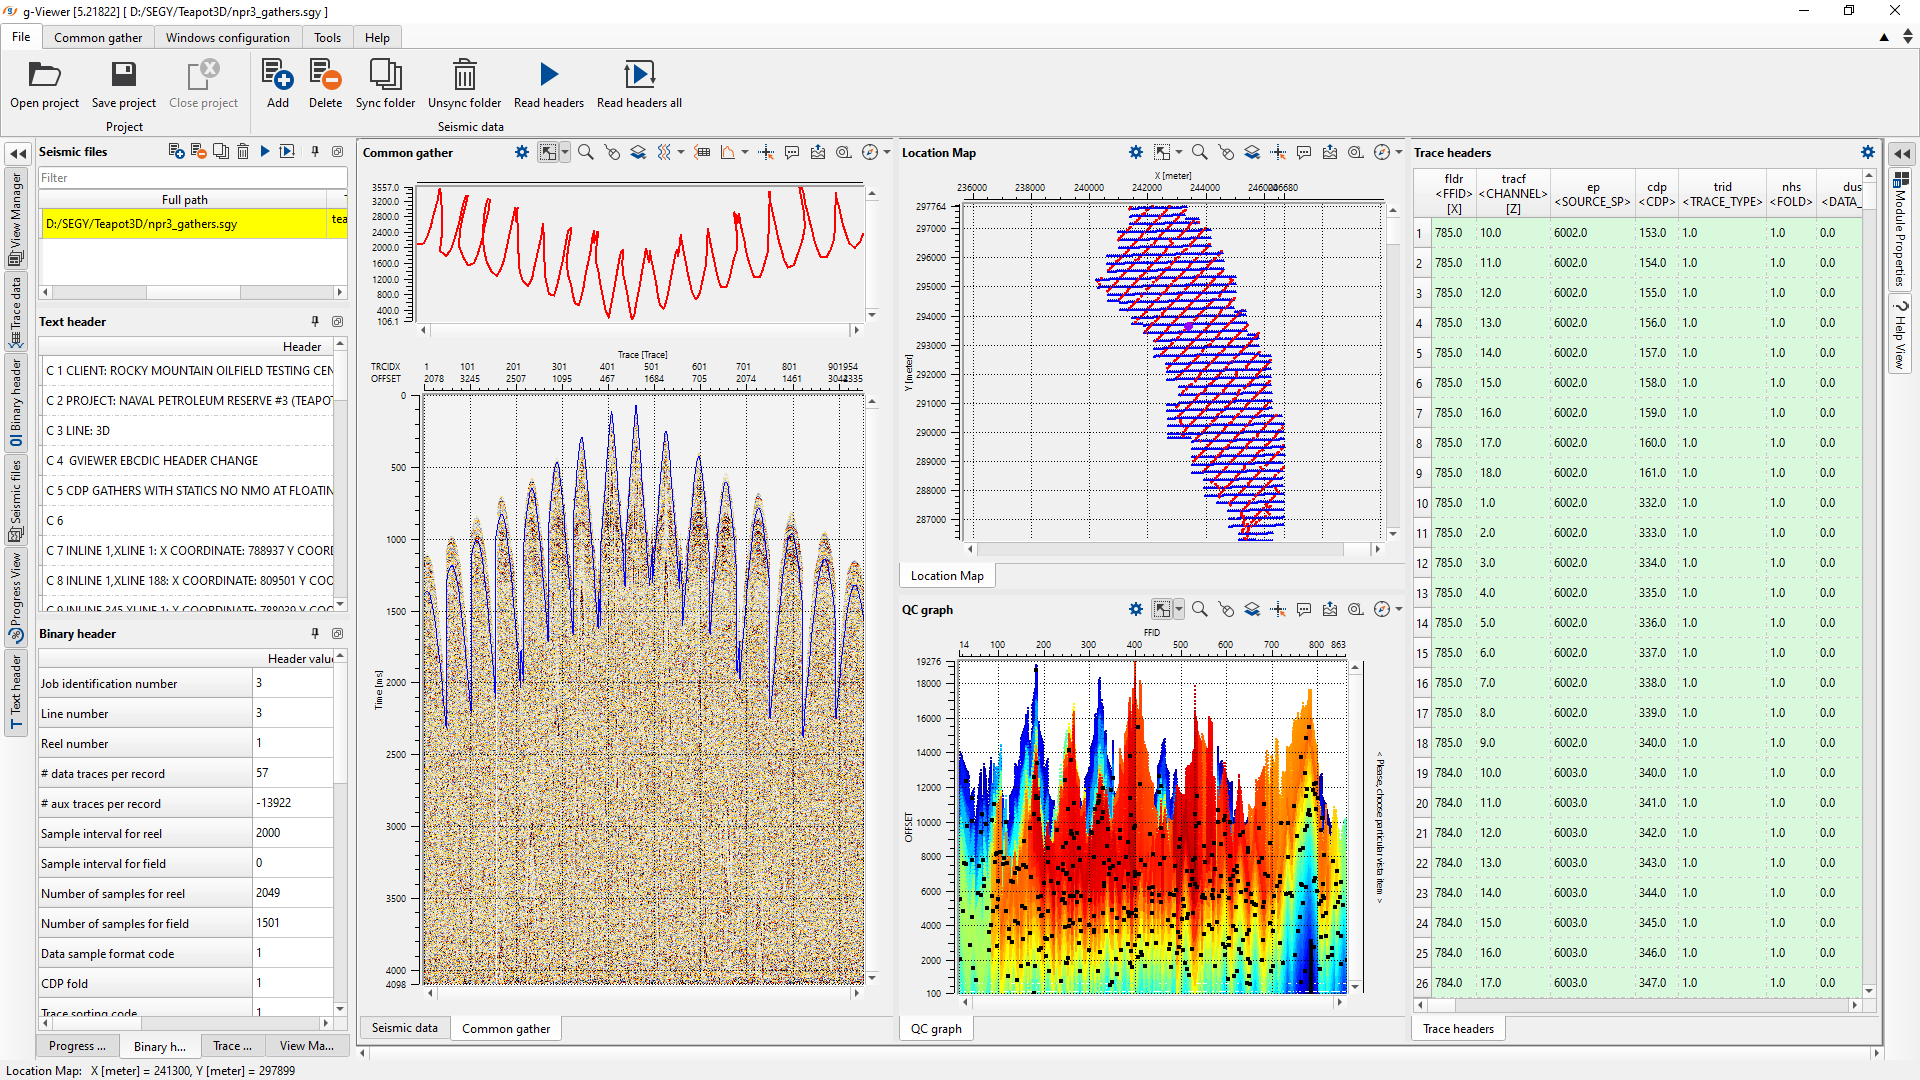
In the above image, we see different windows in the left, middle and right side. Let's jump into Left side windows first.
•View Manager
•Trace data
•Binary header
•Seismic files
•Progress view
•Text header
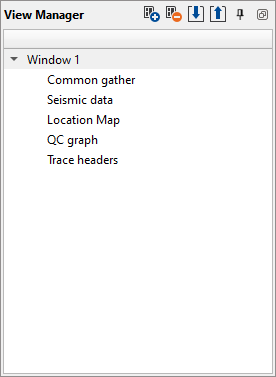
View Manager:
View Manager is a key component to visualize the seismic data. It will display the vista items(any display component of that particular module is known as Vista item(s) like location map, common shot, common bin etc.) Whenever user clicks/selects a particular vista item in the View Manager it will activate the respective display item. The user can add as many View Manager windows as they can (it automatically puts the View Manager window name as the Module name) however please pay attention when selecting the option to display the Vista Groups-> All Groups-> In new window. If the user selects the option as "In current window" then it will mix up with the existing vista items in the View Manager and create confusion.
Note: In the next topic, we are going to discuss more about what and how to get Vista Groups etc.
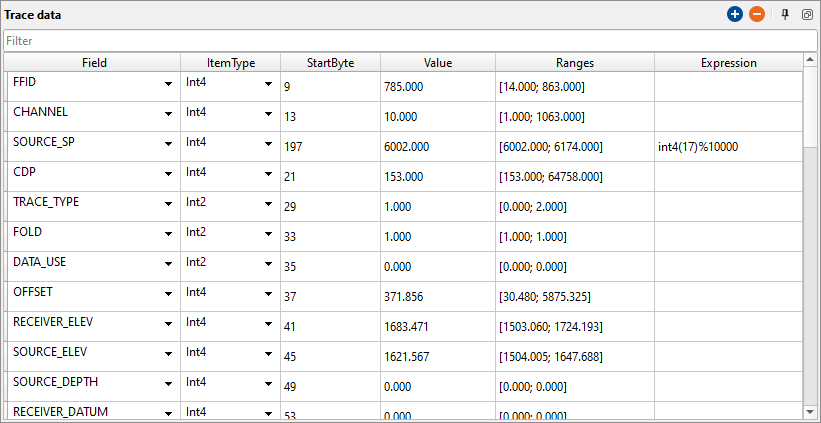
Trace data: This is a very useful window with respect to getting the trace data information. In this window, it displays all the trace headers and their corresponding format type (Integer, float), Start byte location, Value of that particular trace header, Ranges of the trace header and finally an expression to modify the trace headers.
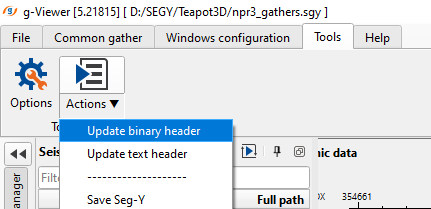
Binary header:
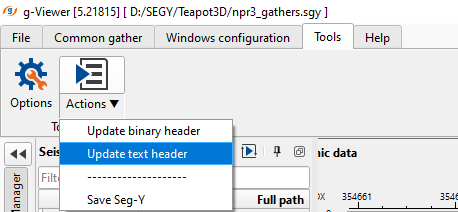
Just like the Text headers, we can able to edit the Binary headers as well. In order to change it, user needs to enter the new value in the “Header new value” field by clicking inside of it and hit Enter. Here also it changes the back ground color which tells us that the field is ready to be edited. Follow the procedure as described above to save the EBCDIC/text header but select “Update binary header” option from the action items
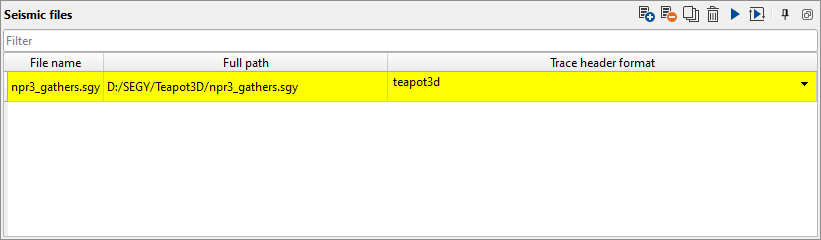
Seismic files:
In this window, the user can add as many as seismic files as they want. There are different ways to add the seismic files into the seismic files window. The simple and most straight forward method is simply click on the plus button ![]() and add the seismic files into the window. Upon adding the files, it will load (can see the status of the loading at Progress view window) the contents of seismic file like Trace data, Text header, Binary header, Trace headers information and Location map.
and add the seismic files into the window. Upon adding the files, it will load (can see the status of the loading at Progress view window) the contents of seismic file like Trace data, Text header, Binary header, Trace headers information and Location map.
The second method of adding seismic files is, drag and drop method. Simply select the desired seismic file (SEG-Y) file and drop into the seismic files window. Give it a minute or two to load the contents of the seismic file.
Within the Seismic files window, it will display the File name, Full path & Trace header format information. If the user wants to display only the File name, they can right click inside the seismic files and uncheck the other fields.
When the SEG-Y file loaded into the g-Viewer, it partially loads all the headers. In order to load all the headers information, the user should select the file and click on the Play button![]() (fast forward button is to load all the lines fully). User can observe the change in color of the back ground before and after.
(fast forward button is to load all the lines fully). User can observe the change in color of the back ground before and after.
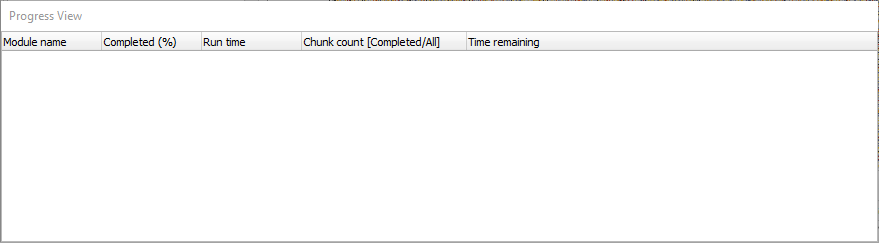
Progress View
This window displays the current running/executing module(s)s status like Module name, % completed, Run time, Chunk count [completed/all] and the time remaining to finish the task.
Text Header:
Editing text (EBCDIC) and binary headers in g-Viewer is straightforward. The user has to go to the Text headers table and make the necessary changes. To update the data with the changes, the user must click on the Actions icon and select the respective action item to implement the changes.
In the middle part of the main g-Viewer, we have
•Seismic data
•Common gather - Common gather [View SEG-Y]
•Location map
•Trace headers
•QC Graph
Seismic data
It is the main display window where the user can able to visualize the entire dataset within a window. The entire dataset is loaded into the memory and display the full content of the data in the seismic data window. However if the user wants to zoom in/out in any part of the "Seismic data" then that particular section of the display will be displayed on the screen.
Common gather - Common gather [View SEG-Y]
This window is useful in displaying any random gather by selecting a location on the location map. More in details were discussed in the Common gather
Location map
With the interactive location map in g-Viewer, the user should find it easy to choose Selected line and/or Selected common gather from the location map by selecting the Control item icon . Within the location map the user can not only can select desired Selected line and/or Selected common gather, but also measure the distance between Shot/Receiver/CMP gathers and/or line length etc. by using the Ruler icon.
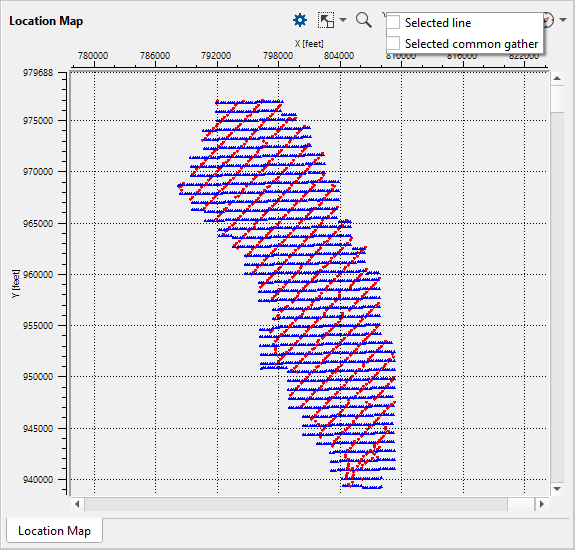
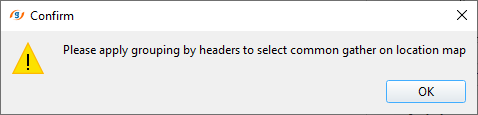
In case the user wants to select any random gather on the location map and decides to choose the option "Selected common gather" then it comes up with a pop-up window
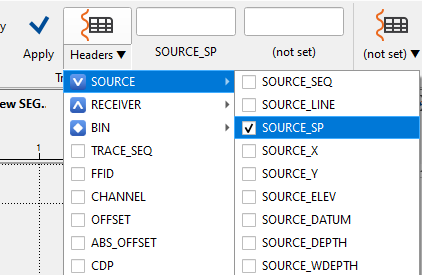
To do the grouping, the user should goto the Common gather type in the ribbon and select the option "Group by"

Now choose one of the headers from the drop down menu of the Headers icon  and click Apply.
Similarly the user can select any trace header and select the desired gather whether a Source/Receiver/CMP gather.
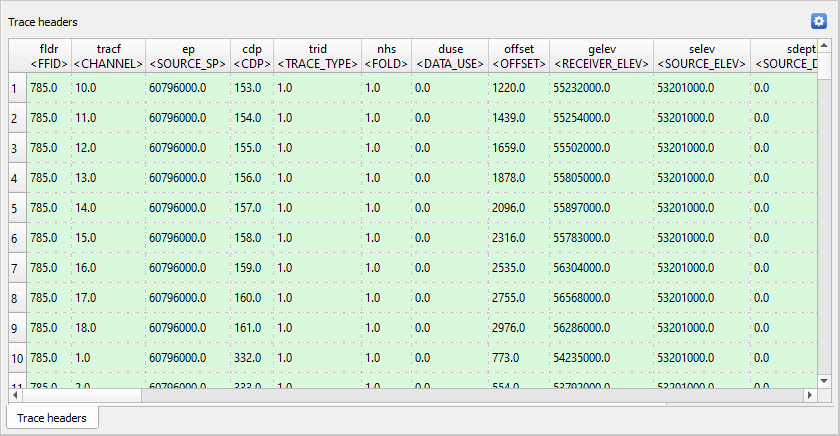
Trace headers
g-Viewer displays all the trace headers information in tabular form. The user can select any particular trace or scan through it to find the desired information. Besides it can be used to cross plot any of the seismic trace headers as a quick QC tool.
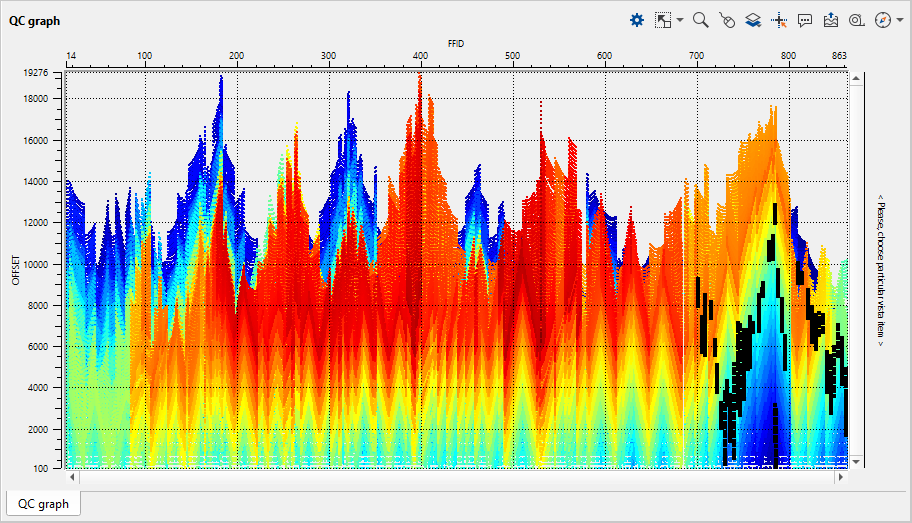
QC graph
In g-Viewer, the user can able to plot any trace header from the trace headers table and QC them immediately and interactively.
Finally in the far right hand side, we see
•Module Properties
•Help View
Let's briefly discuss about each one of them.
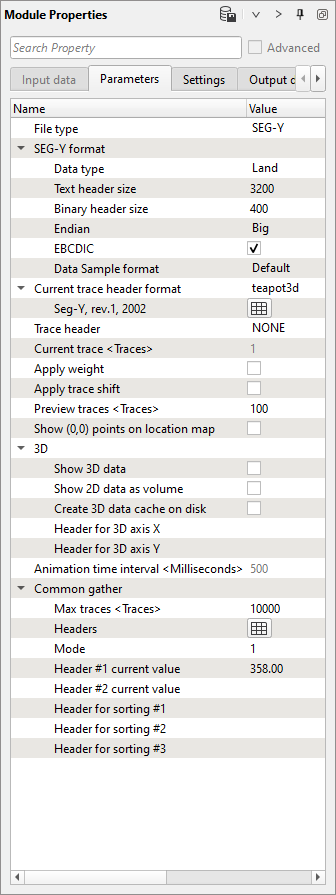
Module Properties
This window/tab allows the user to specify the file name path or edit the parameters. In the below image, we can able to see the Module parameters of View SEG-Y module.
Help View
This window displays the documentation of the selected module wherein it describes the each one of the parameters and their usage etc.