Let's start by getting acquainted with the program by exploring the interface.
Subscribe to our channel and watch g-Viewer interface overview on YouTube
The g-Viewer interface consists of several areas:
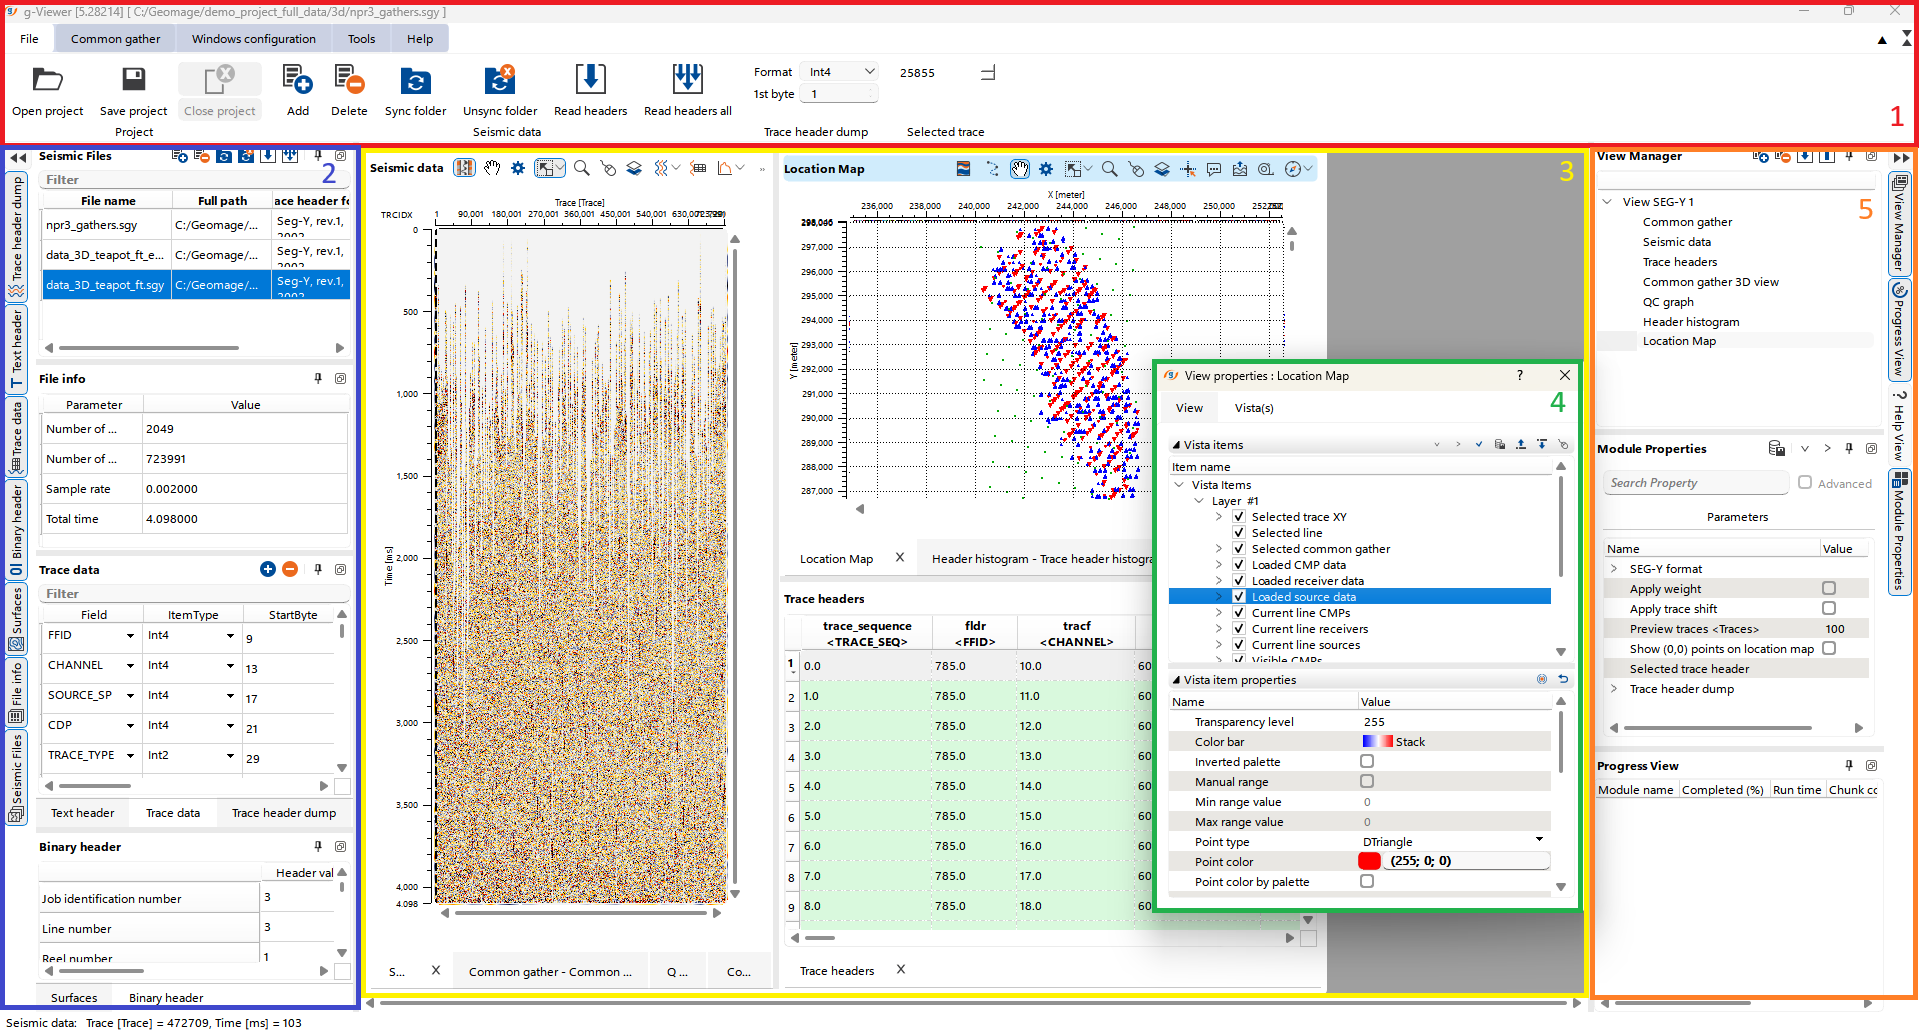
1. The Ribbon bar is the topmost section of the interface, highlighted in the red box. The Ribbon Bar is a place where you can access the main functionalities of the g-Viewer software. It is organized into several thematic tabs that group related tools and commands.
2. The Panels that are located on the left side of the interface, highlighted in the blue box, included: Seismic files, File Info, Trace data, Text header, Trace header dump, Surfaces, Binary header.
3. The Workspace area. The central area of the interface, highlighted in the yellow box. The Workspace area serves as the central hub for data visualization and analysis. This area is dedicated to displaying multiple Views that are part of the project. Each view within the workspace can represent different types of data, such as seismic sections, well logs, map views, etc.
The cursor position can be synchronized on the map and section.
The active window is highlighted in blue as shown in our Location map example, and its corresponding Module Properties Panel is displayed.
4. The View properties is a dynamic panel that allows customization of view settings. The content of the window depends of the selected object.
5. The Panels that are located on the left side of the interface, highlighted in the orange box, included: View Manager, Module Properties, Progress View.
At the bottom of the interface, you can see an information bar that displays data corresponding to the current cursor position, regardless of the active window.