g-Viewer displays all the trace headers information in tabular form. The user can select any particular trace or scan through it to find the desired information. Besides it can be used to cross plot any of the seismic trace headers.
Let's see how we can select a trace from the trace header table and how it synchronizes with the other display views like Seismic data, Location map, QC Graph.
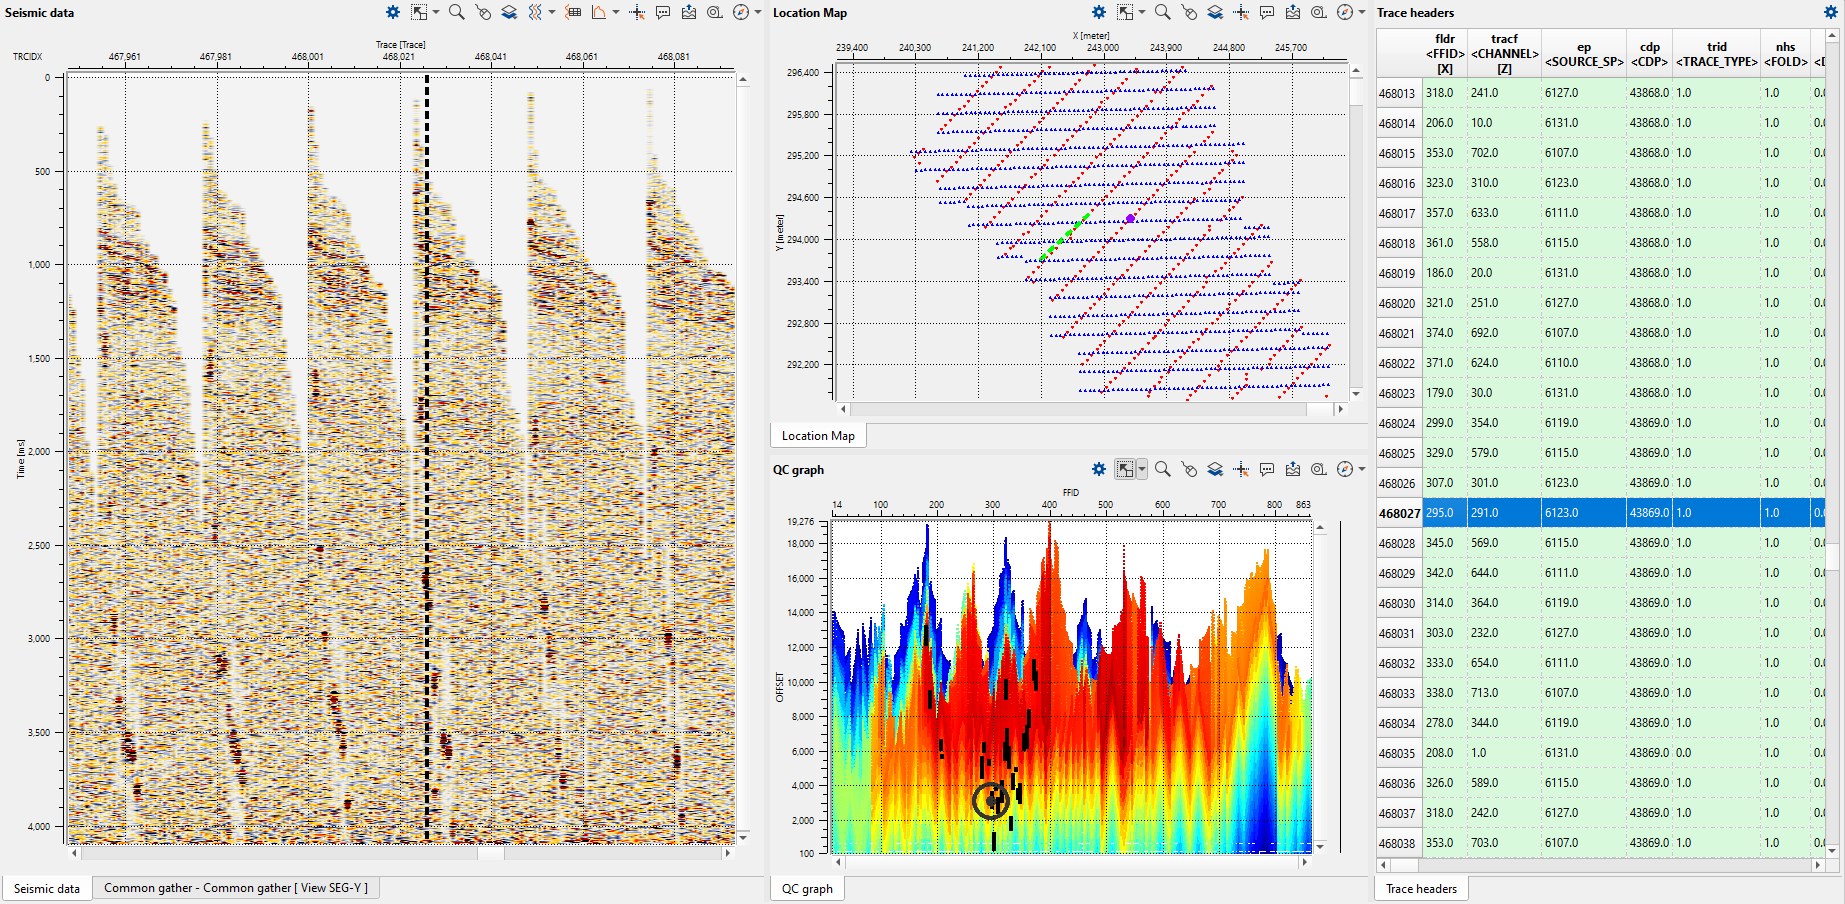
Click on any row in the Trace headers window and the corresponding trace is displayed on the seismic data (as a vertical dotted line) tab, location map(as a Green dotted line) and on the QC graph (as a dot within a circle) as shown below.