In g-Viewer the user can plot any 3 trace headers. 2 trace headers can be plotted as horizontal and vertical axes and the 3rd trace header graphed in color. In the Trace Headers table the user can select any desired trace headers and plot them. The resultant plot can be seen in the QC graph tab.
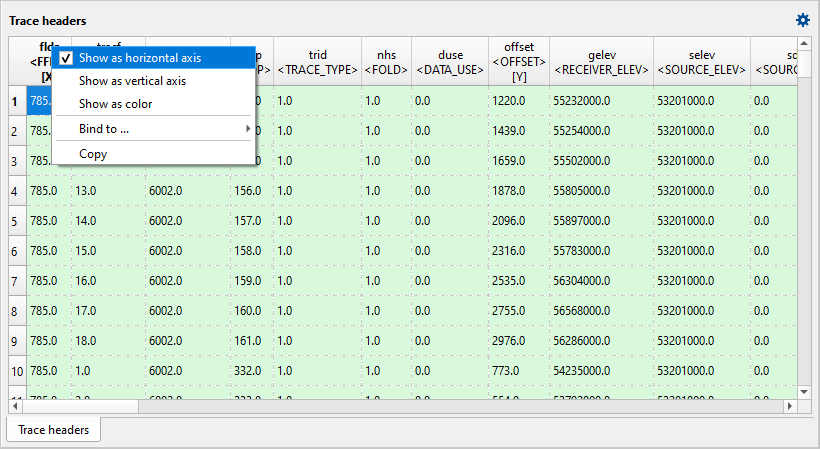
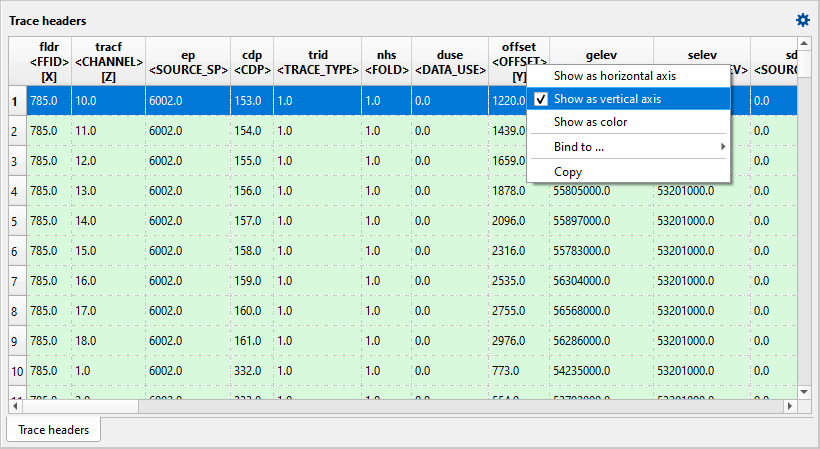
Here we are selecting FFID as horizontal axis. To do that, user should right click on the FFID column and choose Show as horizontal axis option. Similarly we ca select the other trace headers for vertical axis (In this case OFFSET) and color to display.
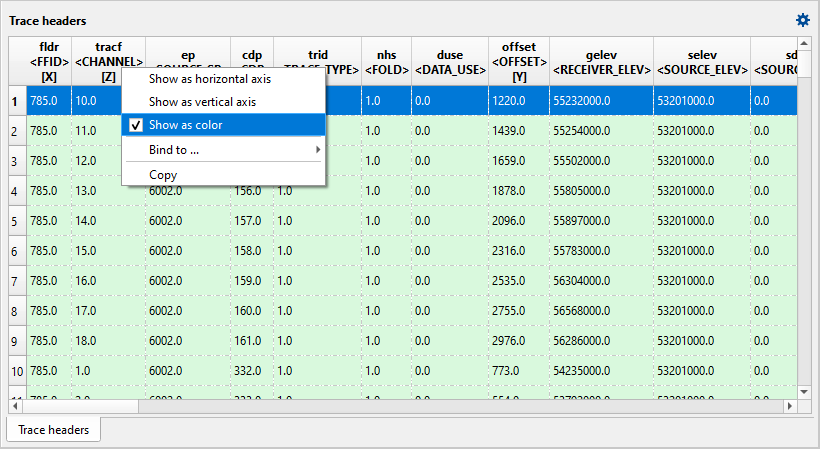
Finally we can select CHANNEL column as a color for the QC graph display.
The resultant QC graph is as shown below.
![]()
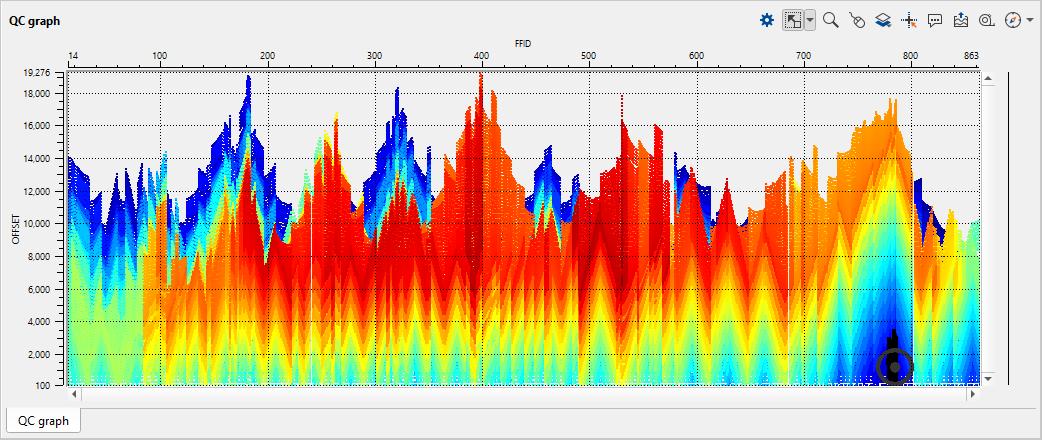
Likewise the user can cross plot any of 3 trace headers to quickly visualize and QC the trace headers in a more efficient way.