Attributes bar allows you to generate/calculate the seismic attributes for further analysis during the seismic interpretation.

For more information about the attributes calculation please refer to chapters Seismic attributes and Spectral decomposition
Consists of 4 sections: On-fly calc, Common settings, Spectral decomposition settings, Execute.
On-fly calc section:
 Consists of one button which opens a context menu. In this menu you can select attributes for maps calculation or select an attribute to see it on the seismic section:
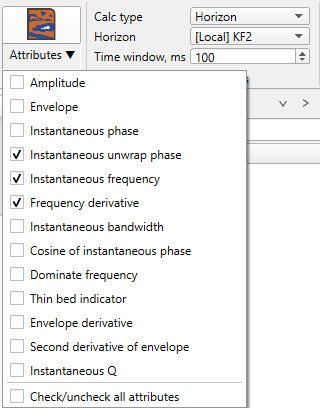
In Common settings section you can choose parameters of calculation:
Calc type Choose type of calculation between horizon or whole seismic dataset
Horizon Choose horizon for calculation
Time window, ms Set time window of calculation
In Spectral decomposition settings section you can choose parameters for this attribute:
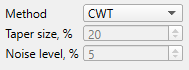 Set method of spectral decomposition calculations and set its parameters
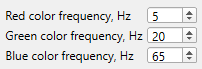 Set colors for each frequency
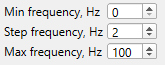 Set boundary parameters for calculations
Execute section:
 Open the window for attributes calculation settings and start of calculation
 Run spectral decomposition
 Run QC for selected horizon picking. This icon is associated with spectral composition to QC and select the parameters from spectral decomposition from the selected horizon
The following list provides a detailed explanation of the seismic attributes available in g-Space. For each attribute, a brief theoretical background is given along with its practical application in seismic data analysis.
Amplitude: Represents the strength or intensity of the seismic signal at each reflection point. Amplitude variations are often related to changes in rock properties, fluid content, or lithology, making it a critical parameter for identifying potential reservoirs, stratigraphic boundaries, and geological features.
Envelope: The envelope is a smooth curve that outlines the peaks and troughs of a seismic wave. It’s often used to detect changes in seismic reflectivity, which can be linked to stratigraphic features, faults, or lithological variations. The envelope highlights zones of high energy and can improve the interpretation of complex seismic events.
Instantaneous Phase: The instantaneous phase attribute measures the phase angle of the seismic signal at any given point in time. This attribute is phase-independent, meaning it is not influenced by amplitude variations, making it useful for identifying continuous horizons and tracking lateral continuity in the subsurface.
Instantaneous Unwrap Phase: This is an unwrapped version of the instantaneous phase, where discontinuities in phase values are removed, providing a continuous phase profile. It helps in mapping stratigraphic layers more precisely, especially in areas where reflectors might be obscured by phase wrapping.
Instantaneous Frequency: This attribute calculates the frequency of the seismic signal at each point in time. It highlights changes in frequency that may correspond to subsurface geological variations such as layer thickness, rock types, and depositional environments. Instantaneous frequency is often used for high-resolution stratigraphic interpretation.
Frequency Derivative: The frequency derivative shows the rate of change of frequency over time. Rapid changes in frequency can indicate transitions between different rock types or depositional environments. It helps in identifying seismic features such as unconformities, thin beds, or channel boundaries.
Instantaneous Bandwidth: Instantaneous bandwidth represents the range of frequencies present at any point in the seismic signal. A higher bandwidth often indicates more complex geological structures, while a lower bandwidth can be associated with simpler, homogeneous layers. This attribute is useful for characterizing reservoir quality and seismic resolution.
Cosine of Instantaneous Phase: The cosine of the instantaneous phase converts phase information into a continuous waveform, emphasizing differences in phase between neighboring traces. This attribute is valuable for identifying faults, stratigraphic discontinuities, and other structural features that may be missed with traditional amplitude-based interpretation.
Dominant Frequency: Dominant frequency refers to the most prevalent frequency in the seismic signal. It can indicate the average thickness of the subsurface layers and is often related to depositional environments. A lower dominant frequency suggests thicker layers, while a higher frequency points to thinner beds or more rapid changes in geology.
Thin Bed Indicator: This attribute is designed to identify the presence of thin beds that are smaller than the resolution of the seismic wavelength. By analyzing amplitude and frequency variations, it highlights subtle features that might not be clearly visible in standard seismic attributes, helping to detect important stratigraphic details in thinly bedded reservoirs.
Envelope Derivative: The envelope derivative measures the rate of change in the envelope of the seismic signal. It is useful for pinpointing areas where there is a significant transition in reflectivity, which may correspond to abrupt lithological changes, fault zones, or sharp depositional boundaries.
Second Derivative of Envelope: The second derivative of the envelope further enhances areas of rapid change in reflectivity. This attribute is particularly useful for detecting fine geological features that may be missed with other attributes, such as thin layers or subtle faults.
Instantaneous Q: Instantaneous Q represents the quality factor of the seismic wave, which measures the attenuation of the signal as it travels through the subsurface. High Q values suggest lower attenuation (indicating harder or more solid rock), while low Q values indicate higher attenuation (associated with softer rock or the presence of fluids). This attribute is often used to infer rock porosity or fluid content in reservoirs.
Coherence: Coherence measures the similarity of seismic traces across a specified window, helping to highlight discontinuities in the subsurface such as faults, fractures, or stratigraphic boundaries. It is a powerful tool for fault interpretation and for identifying subtle geological structures that may not be visible in standard amplitude data.
Similarity: Similarity compares seismic traces within a neighborhood and highlights differences in waveform shapes. This attribute is often used to identify features such as faults, channels, and stratigraphic boundaries, as well as variations in rock type or fluid content.
Chaos: The chaos attribute detects areas where the seismic signal appears disordered or non-coherent, often corresponding to zones with complex geological structures such as fault zones, fractured reservoirs, or highly heterogeneous formations. It can help interpret regions where seismic reflections are disrupted or unclear.
Seismic Relief: Seismic relief highlights the vertical variation in subsurface reflector depth, providing a clear representation of topography and structural variations. It is useful for identifying features such as anticlines, synclines, fault blocks, and other geological structures that involve significant elevation changes in the subsurface.