Modelling
The Modelling bar provides tools for creating maps, building fault frameworks, and generating structural models from interpreted seismic and geological data.

The bar consists of the following sections: Mapping, Map calculator, Fault Modeling and Structural Modeling.
Mapping
Holds the interpolation settings used for map generation, together with the Settings and Map building commands. Two parameters are set directly in the bar:
- Interpolation — the algorithm used to build the map. The available methods are ABOS, Kriging and Adaptive Snap.
- Step X / Step Y — the grid cell size of the resulting map.
Map building opens the Map building dialog, which builds a map from a horizon, from well markers or from a point set, using its own set of parameters. It stays open while you work, so maps can be built one after another.
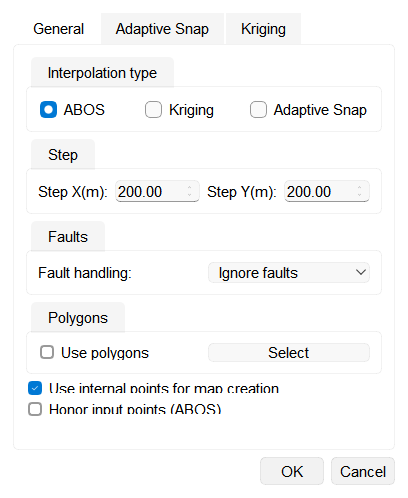
Every other interpolation parameter is set in the Interpolation parameters dialog. Click Settings  in the Mapping group to open it. The General tab holds the interpolation type, the grid steps, Fault handling, Use polygons and Use internal points for map creation; the ABOS, Adaptive Snap and Kriging tabs hold the options of the corresponding method. The full set is also available from the Module Properties panel.
Fault handling
The Faults group of the interpolation settings defines how faults are used when a map is built. Select one of the following in the Fault handling list:
- Ignore faults — faults are not taken into account and the map is interpolated continuously across them. The remaining fault controls are hidden.
- Use selected faults — click Select faults... and tick the faults to be used as barriers. The label beside the button shows how many faults are ticked, or All when the selection is empty and every fault of the project is used.
- Use fault model — choose one model in the Fault model list and use its surfaces as the barrier framework. Build the model in Fault Modeling first; a model whose surfaces have not been built leaves the map without fault barriers.
With Use selected faults and Use fault model the map is interpolated separately on each side of a fault, so values are not smoothed across it, and Fault clear radius becomes available. Input data lying closer to a fault than this distance is discarded and that strip is rebuilt from the reliable data further away, which removes noisy picks along the fault without leaving the strip empty. With a radius of 0 the input data is used as it is, and only the grid cells crossed by a fault separate its two sides. Only faults and models of the same domain as the map, time or depth, are applied.
Where a fault classified as Normal crosses the grid, the cells along its trace stay empty, so the map is interrupted along the fault line; faults of the other types keep the map continuous. See Faults for assigning the fault type.
The mode, the selected faults or model, and the clear radius are stored with the interpolation settings, so every action that creates or recreates maps from horizons, points or markers uses them.
ABOS
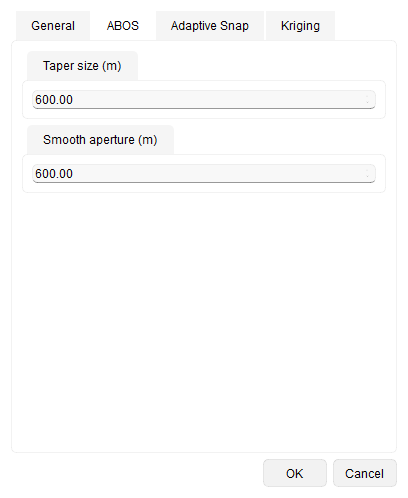
ABOS builds the map by approximating the input data in successive iterations and then smoothing the result. When ABOS is selected, the following additional parameters are available on the ABOS tab of the interpolation settings dialog:
- Taper size — how far from the input data the smoothing reaches its full strength. At a control point the approximated surface is kept as it is; the further a node lies from the nearest input point, the more of the smoothed surface is used, until at this distance the map is fully smoothed.
- Smooth aperture — the size of the averaging window applied to the finished map. Set it to 0 to leave the map exactly as the approximation produced it.
Both groups carry the unit of the project measurement system in their caption, for example Taper size (m) or Taper size (ft).
Adaptive Snap
Adaptive Snap is a convergent, coarse-to-fine interpolation method. It builds the map from the input data over successive refinement levels and snaps the final surface onto the input control points, so the resulting map honours the picked data. Mixed input data (points and interpreted horizons) can be used together as control data, and faults can be applied as constraints to preserve structural discontinuities.
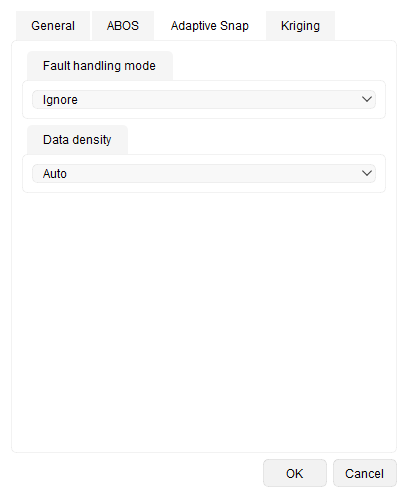
When Adaptive Snap is selected, the following additional parameters are available on the Adaptive Snap tab of the interpolation settings dialog:
- Fault handling mode — controls how faults constrain the interpolation. The options are Ignore (the map is continuous across faults), Barrier (faults block the exchange of values between their two sides, preserving discontinuities) and Final refinement only (faults are ignored during the early levels to keep the regional trend and applied only in the final pass to introduce local discontinuities).
- Data density — tells the method how the input control data is distributed, so that it can adapt the way values are smoothed between the control points. Auto, the default, derives this from the spacing of the input data and the grid step. Select Sparse (wells) when the map is built from a few widely spaced points, such as well markers, or Dense (grid) when the input data is closely spaced, such as an interpreted horizon grid.
Kriging
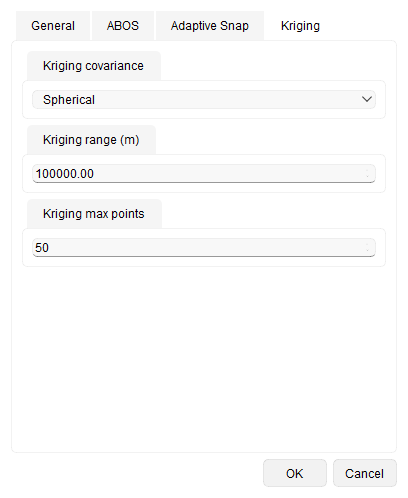
When Kriging is selected, each node of the map is estimated from the nearest input points, weighted by a covariance model. The following additional parameters are available on the Kriging tab of the interpolation settings dialog:
- Kriging covariance — the covariance model that defines how the influence of an input point falls off with distance. The options are Spherical, Gaussian and Exponential.
- Kriging range — the correlation distance of that model. Input points lying far beyond this distance from a node contribute practically nothing to its value. The group is labelled Kriging range (m) or Kriging range (ft), following the measurement system of the project.
- Kriging max points — how many of the nearest input points are used to estimate each node.
For more information about map building please refer to Map creating.
Map calculator
Performs arithmetic and logical operations on maps (depth maps, velocity maps, and others) to create new calculated map outputs based on user-defined expressions.
The group contains Open map calculator, Calculate isopach, and Residual calculation.
 Open map calculator
Fault Modeling
Builds a fault framework from interpreted fault data to support structural analysis and geological model construction.
Structural Modeling
Creates a structural model using horizons, faults, and maps to represent the main geological framework of the reservoir. See Structural modeling and Geological modeling for the full workflow.
See Also