Spectrum analysis is a fundamental tool in seismic data processing.
 Spectral computations are available in Vista Views that display seismic traces.
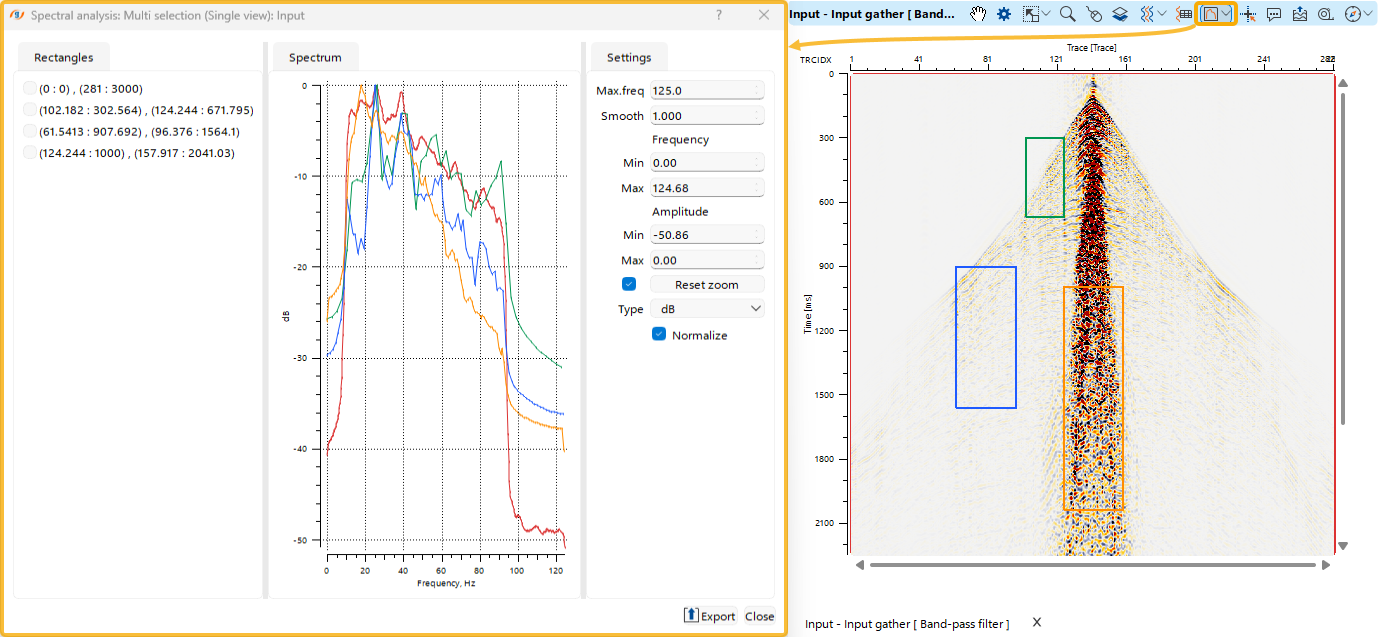
When the user clicks the corresponding Shortcut Button ![]() , the Spectra dialog window opens. In this window, spectra are computed for time windows that are interactively defined by the user on the Seismic Gather Vista View. Each computed spectrum is displayed using the same color as its corresponding window on the seismic gather (section).
, the Spectra dialog window opens. In this window, spectra are computed for time windows that are interactively defined by the user on the Seismic Gather Vista View. Each computed spectrum is displayed using the same color as its corresponding window on the seismic gather (section).
The user can also adjust additional visualization parameters in the Settings tab of the Spectra dialog window.
The following spectrum representations are available:
•Amplitude
•Phase
•Energy
•dB (Logarithmic)