Individual Vistas and their elements are configured in the Vista(s) tab of the View Properties dialog.
Vista(s) tab consists of two sections: Vista items (1) and Vista item properties (2).
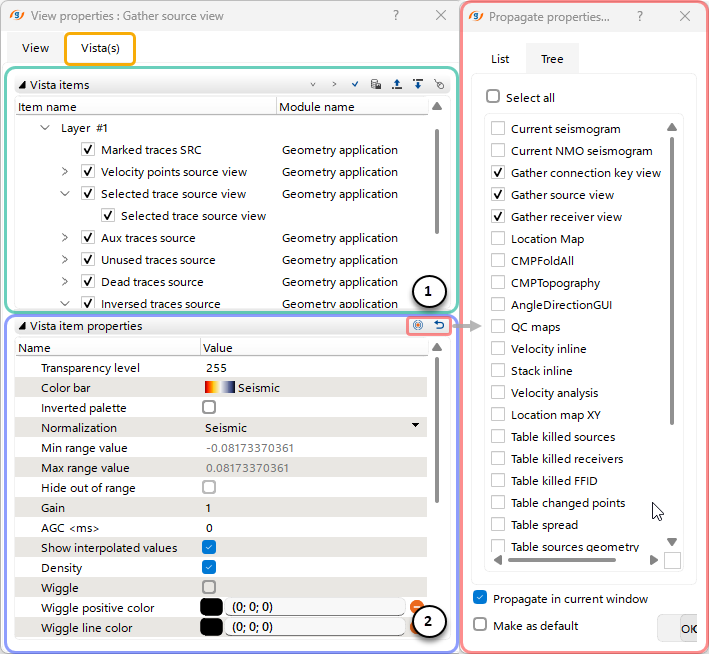 Vista items (1) - allows the user to turn on/off visibility of the objects on the view. This is dynamic part of the window and shows the items according to the active view.
In the top-right part of the section, the user can use Shortcut Buttons ![]() to reorder layers
to reorder layers ![]()
![]() , toggle visibility of all objects
, toggle visibility of all objects ![]() , expand
, expand ![]() or collapse
or collapse ![]() all nested lists, save an item to the database
all nested lists, save an item to the database ![]() , and set the Control Item
, and set the Control Item ![]() .
.
In the Module Name column, the user can also see which module the Vista was opened from.
Vista item properties (2) section gives access to settings of selected object in the Vista items section. The settings list may vary depending on the active item type.
At the top, the user can reset properties to default values ![]() or propagate
or propagate ![]() them to other Vistas of the same type via a pop-up dialog.
them to other Vistas of the same type via a pop-up dialog.
The following Settings can be adjusted for the active Vista Item (options may vary depending on the Item type):
•Transparency level - Sets the opacity level of the item
•Color bar - Sets the color bar (palette) from a predefined list
•Inverted palette - Enable/Disable inversion of the color palette
•Normalization - Select the source for color range
•Manual range - Enable/Disable manual setting of min/max range values
•Min/max range value - Select the min/max range values for the current color palette
•Hide out of range - Hides values outside the manually selected range values
•Gain - Set the gain for the visualization
•AGC <ms> - Sets the time window for Automatic Gain Control (AGC) application (Default 0 - not applied)
•Enable band-pass - Enable/Disable Band-Pass Filter for the seismic view
•Band-pass F1/F2 - Sets the Start/End frequency for the enabled Band-Pass Filter
•Spherical divergence - Sets the T2 value for the spherical divergence amplitude correction (Default 0 - not applied)
•Interpolation values type - Sets the interpolation method for the view (None - disable interpolation).
•Density - Enable/Disable density mode of the view
•Wiggle - Enable/Disable wiggle mode of the view
•Wiggle positive color - Set the color for positive values in Wiggle mode
•Wiggle line color/width - Set the color/width of the curve in Wiggle mode
•Wiggle line antialiased - Enable/Disable antialias mode for the view in Wiggle mode
•Wiggle clipping - Sets the clipping value for trace curves relative to neighboring traces
•Wiggle positive on right - Enable/Disable inversion of positive values in Wiggle mode
•Enable errors on matrix - Enable/Disable errors on matrix
•Auto normalization - Enable/Disable auto-normalization mode of the View
•Value precision - Sets precision of the displayed data
•Isolines show mode - Allows to turn on isolines
•Major each isoline - Sets the step of the bold isolines
•Minor line size - Sets thickness of minor isolines
•Minor line color - Sets color of minor isolines
•Major line size - Sets thickness of major isolines
•Major line color - Sets color of major isolines
•Isolines round mode - Sets isolines smoothing
•Show isolines labels - Shows isolines values
•Isolines color by palette - Sets isolines color according the color bar
•Point type - Sets points style
•Point color - Sets points color
•Point color by palette - Sets points color according to the color bar
•Point size - Sets points size
•Line color - Sets line color
•Line transparency - Sets the opacity level for the line
•Connection type - Sets the connection type for the points
•Line type - Sets line style (like solid, dashed, dotted etc.)
•Label position - Sets the label position
•Points label position - Sets the label position for the points
•Points rotation angle - Sets the points rotation
•Fill type - Allows to fill the object
•Fill color - Sets the first filling color
•Fill color2 - Sets the second filling color
•Columns precision - Set the precision level of the values for the Spreadsheet
•Sorting enabled - Enable/Disable the sorting of the values for the Spreadshet