Effective visualization helps in identifying and tracing geological features, which are essential for building accurate geological models.
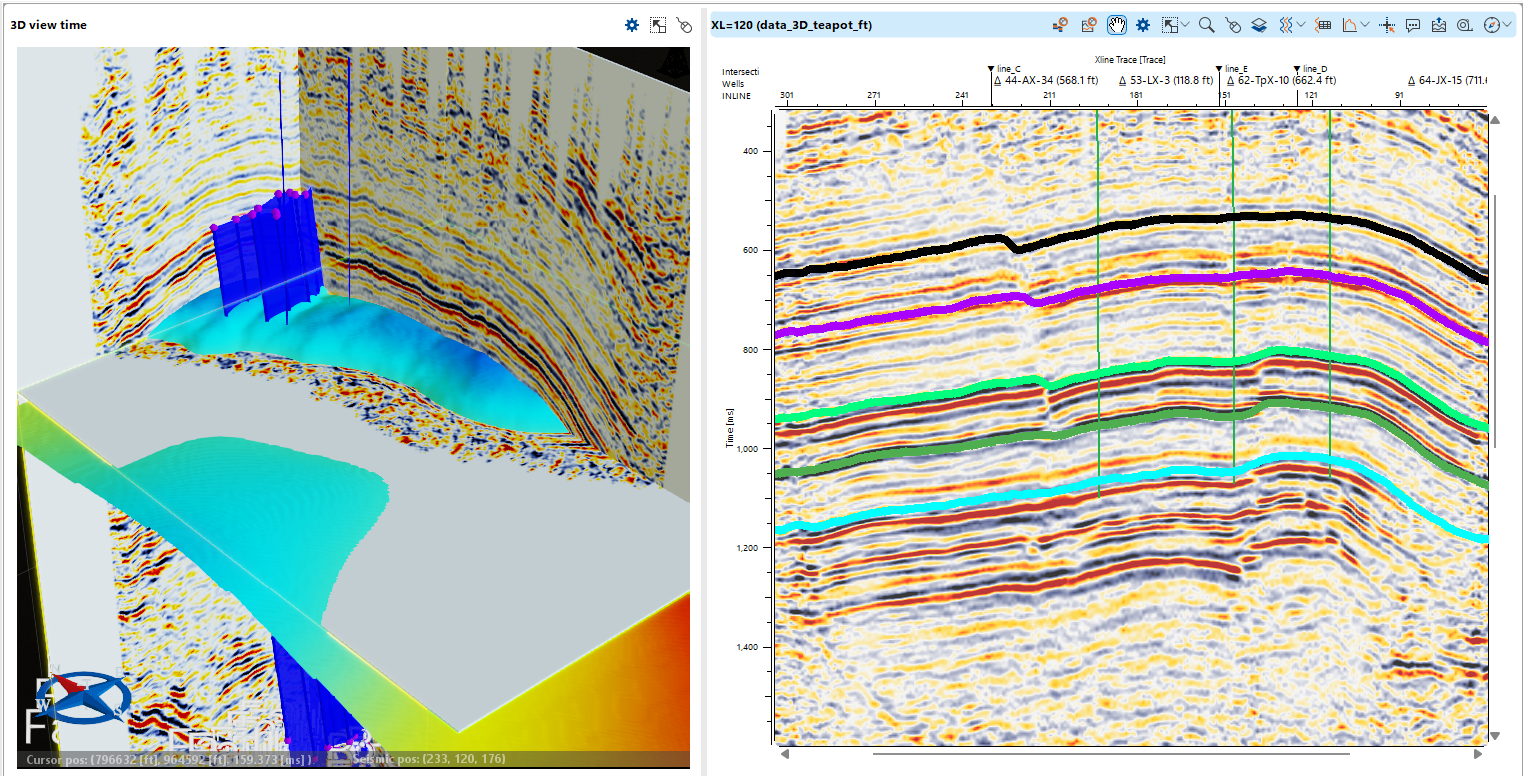
In g-Space, several types of data visualization can be utilized, each serving a specific purpose in the interpretation process. These include 2D seismic sections for detailed layer-by-layer inspection, 3D volumes for a more comprehensive spatial overview, and attribute maps that reveal specific characteristics such as amplitude or coherence anomalies.
The availability of multiple visualization modes in g-Space, such as interactive zooming, rotation, and filtering, enhances the user’s ability to accurately interpret seismic data. Users can switch between these views through the View Manager, enabling seamless navigation and analysis across different data types. This flexibility supports both large-scale structural analysis and finer-scale reservoir characterization.
When tracing horizons, use the flattening feature in g-Space to align your seismic data along a selected horizon. This makes it easier to identify continuous features and avoid misinterpretation.
Remember that seismic data can sometimes contain noise or artifacts. Use filters and attribute analysis to enhance the clarity of your data before making final interpretations.
Notes
Without effective visualization, it is challenging to interpret complex seismic datasets, as the relationships between geological features can easily be overlooked.
Visualization also plays a role in attribute analysis. Seismic attributes, such as amplitude, frequency, or coherence, provide additional insights into rock properties and fluid content. Displaying these attributes in visual formats, such as attribute maps or color-coded 3D volumes, allows interpreters to analyze subtle changes in the seismic response, leading to a more detailed and accurate geological interpretation.
In g-Space, these theoretical principles are put into practice through tools that support dynamic data manipulation, real-time updates of seismic displays, and interactive exploration of multi-dimensional datasets.