Once the maps are generated, they can be edited using g-Space’s Map Editor. The editor provides tools for refining, annotating, and enhancing your maps for presentations or further analysis.
In the Views bar, select the Map Editor View to open the map editing interface.

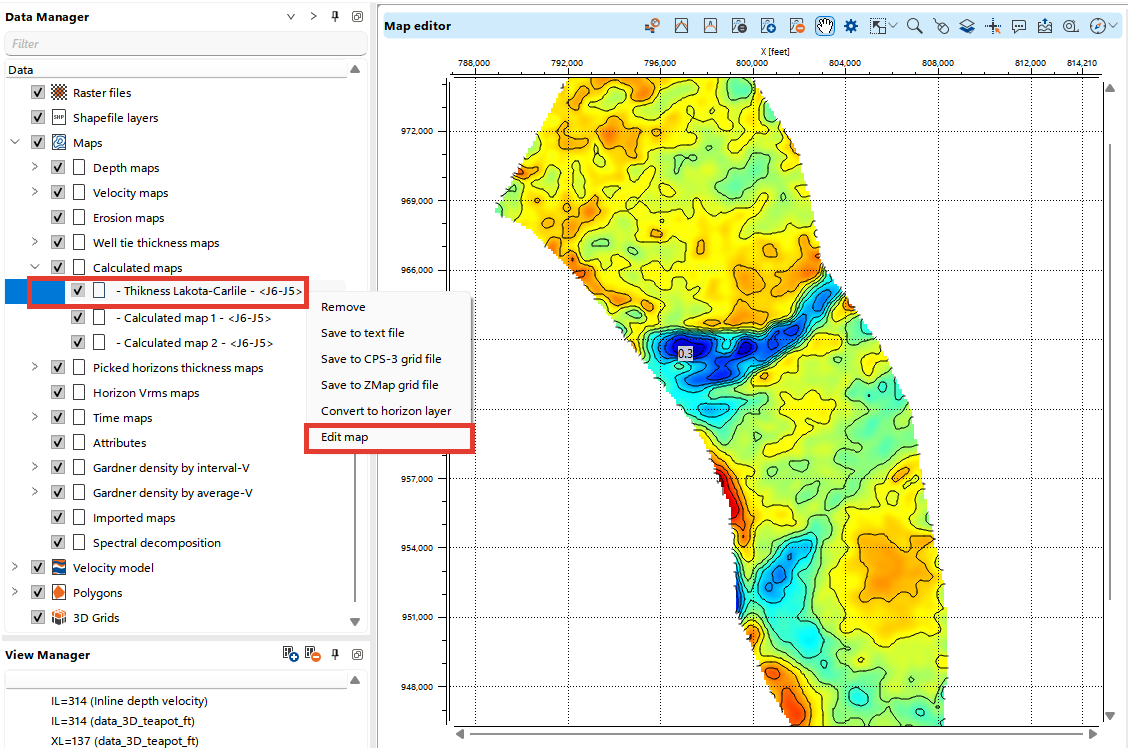
In the Data Manager, locate the map you want to edit.
Right-click on the map and select Edit map. The selected map will then be displayed in the Map Editor View.
In the Visual Settings panel, adjust the visualization settings to customize the appearance of the map. This includes color scales, isolines, and other display options to better represent the data.
The full range of settings is available in the description of the Map editor view
Below are some practical examples of using map editing tools.
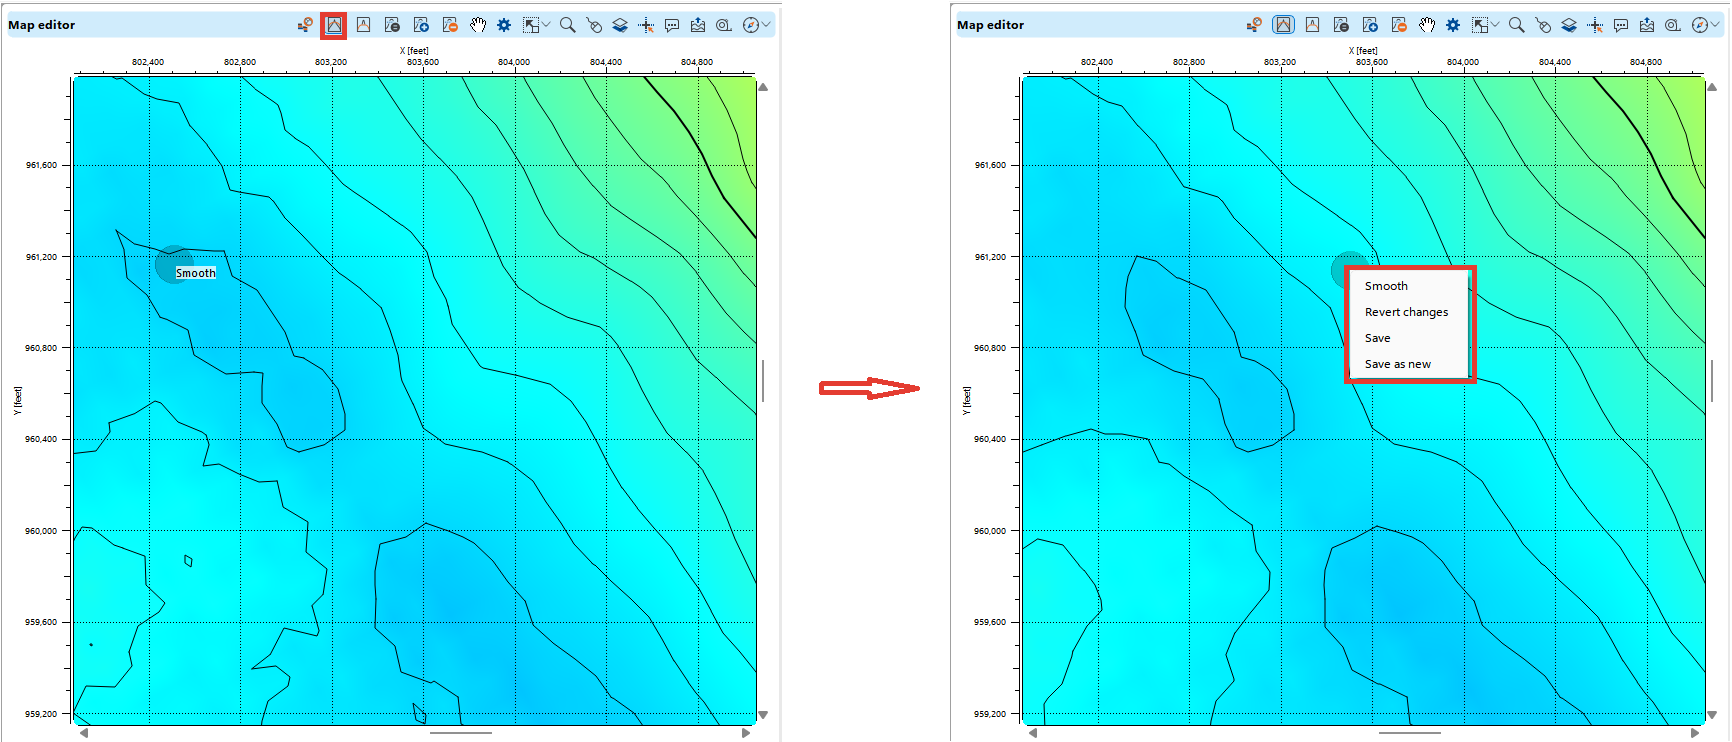
The Smooth tool is designed to reduce sharp gradients, noise, or irregularities in map data, making it more continuous and geologically realistic.
To undo changes, press Alt and right-click the mouse. A menu will appear, providing options to revert the changes or proceed with other actions.
Notes
Depth maps generated from seismic horizons can sometimes exhibit small, unnatural variations caused by interpolation or gridding.
Velocity models often have abrupt changes between zones that may not accurately reflect the gradual transition of rock properties.
Faults may introduce sharp breaks or offsets in horizon maps.
After gridding well, seismic, or attribute data, sharp transitions may occur due to data gaps or uneven distribution.
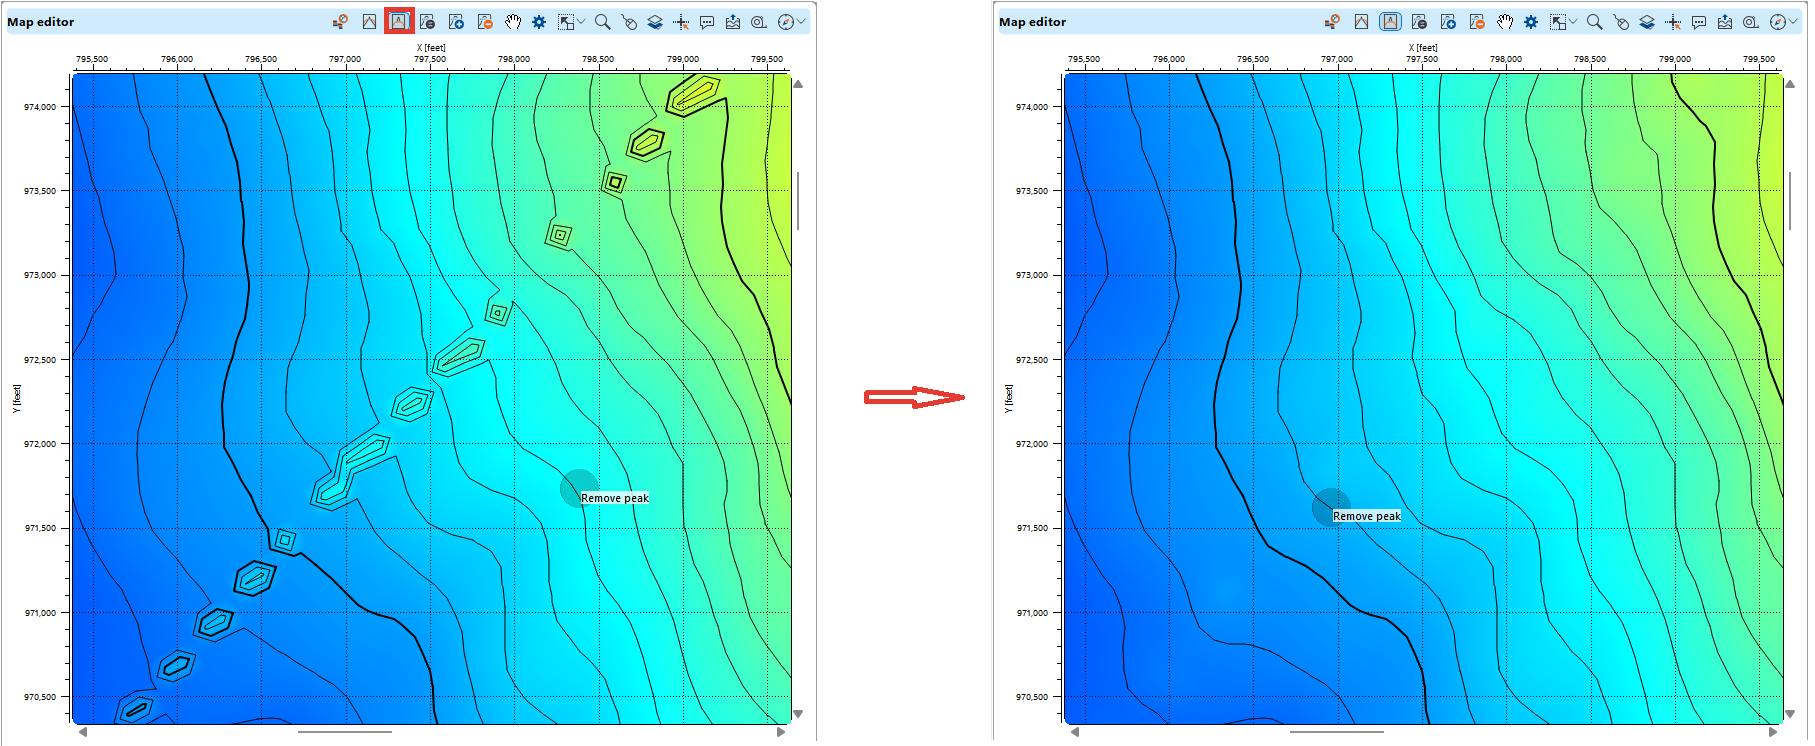
The Remove Peak tool is particularly useful in geophysical and geological workflows where small, isolated, or anomalous high points (peaks) in the data may distort interpretation or modeling.
Notes
Seismic attribute maps, such as amplitude or frequency maps, may occasionally contain small, spurious peaks due to noise or localized data inaccuracies.
In structural geology, isolated peaks in depth or time maps may not represent true geological structures but rather noise or interpolation artifacts.
For large regional studies, maps may exhibit peaks that are not representative of the broader geological trend, often due to noise, small-scale structures, or surface irregularities.
In velocity modeling, spurious velocity spikes may cause errors in depth conversion and lead to misinterpretations of subsurface features.
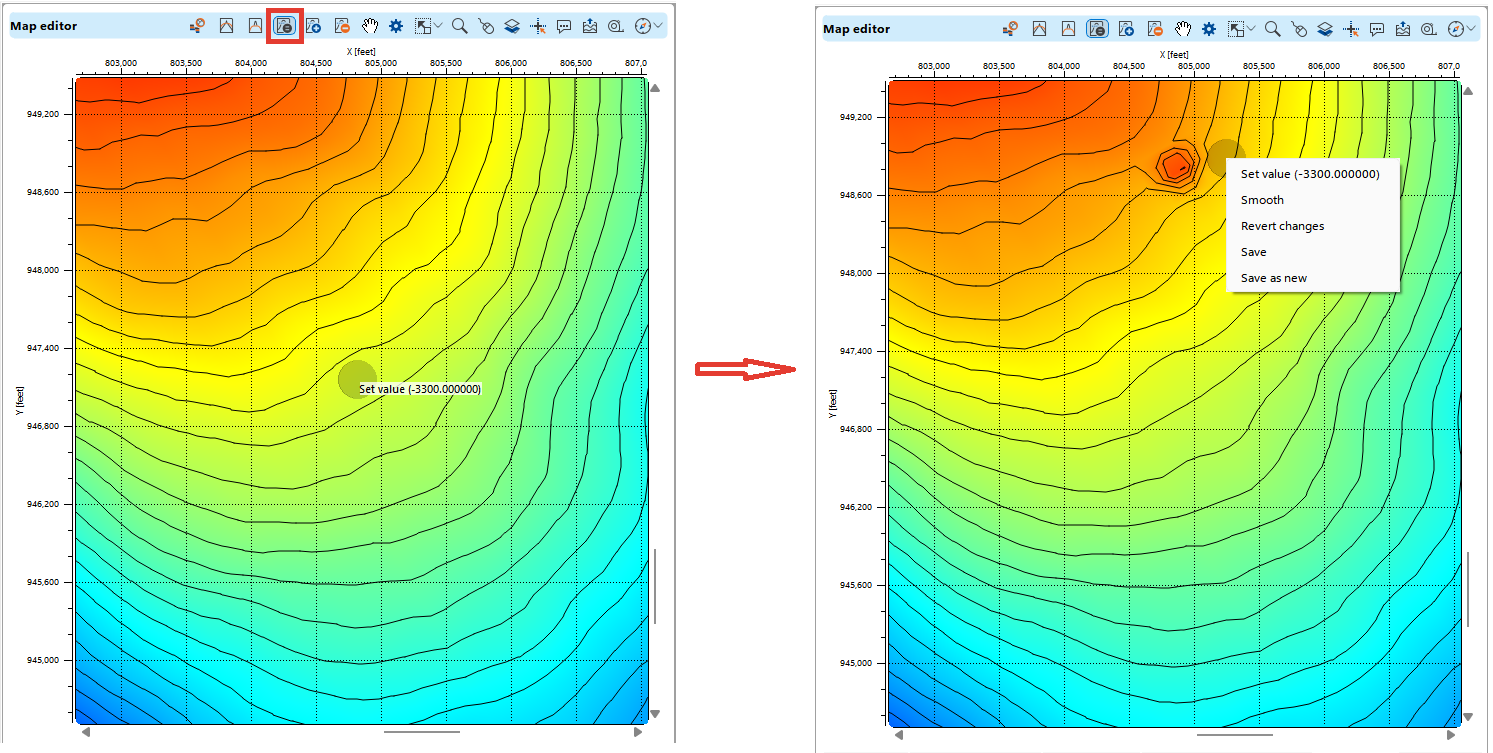
The Set value tool allows you to assign a specific value to any part of the map. This is useful for correcting or standardizing certain areas of the map where the data may not accurately represent the real geological or geophysical structure.
To set a particular value or revert changes, press Alt and right-click the mouse. A menu will appear, providing options.
The Add value and Subtract value tools allow you to increase or decrease the values at any part of the map by a specified amount, facilitating data adjustments; after selecting the tool, you can define the amount you want to add or subtract from the current map values by pressing Alt and right-clicking the mouse, at which point a menu will appear, providing options.
Creating, editing and saving faults in Map editor View is described in detail in the Faults chapter.