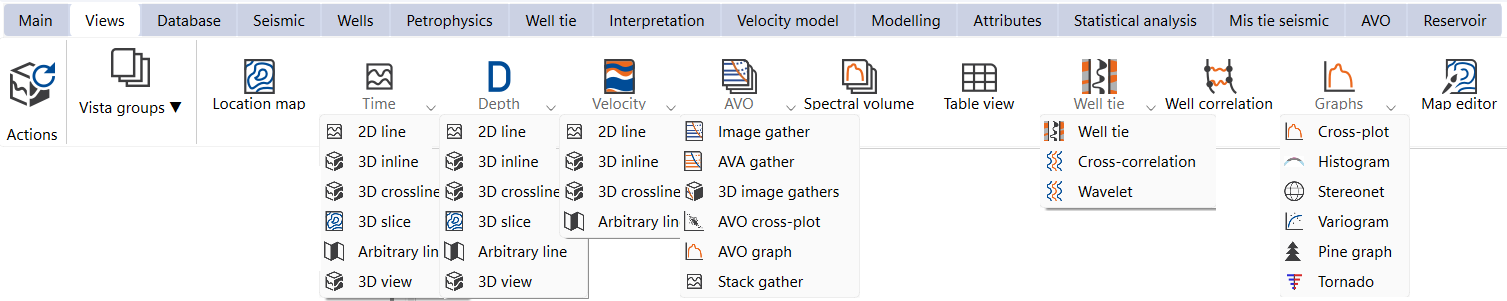
Views bar allows to add different functional views into the current workspace.
 Actions - Update 3D view
 Object groups - specific views which are not presented as buttons on the right
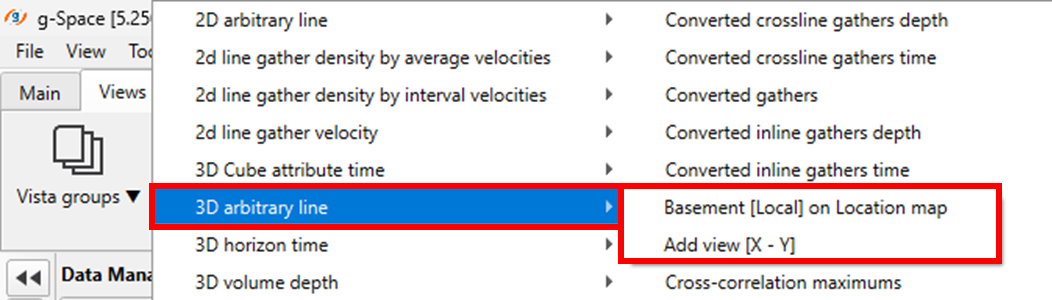
 Objects - contains all objects can be displayed. Each object has an option to be added to view of current workspace or in the new one:
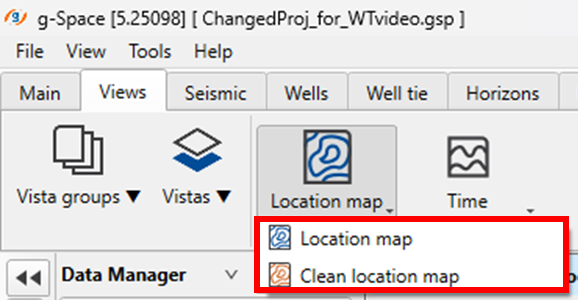
 Location map - creates map view with ability to show and control loaded GIS-type data, such as seismic, well data geometry, polygons, arbitrary lines, maps, horizons, etc.
It has two options: create blank location map and create location map with objects added:
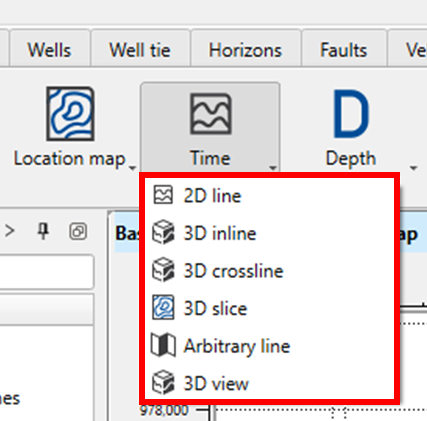
 Time - allows to add different seismic views in time domain (2D line, 3D inline, 3D crossline, 3D slice, Arbitary line, 3D view):
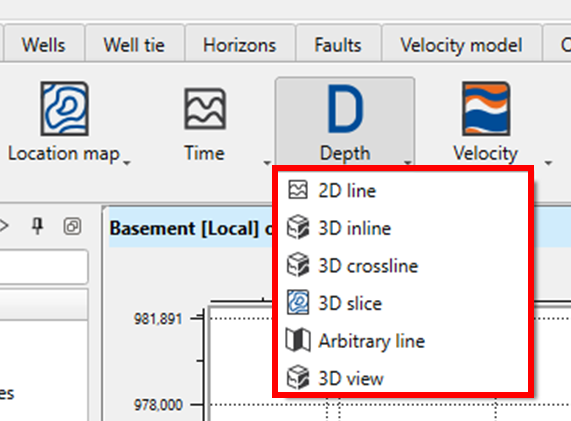
 Depth - allows to add different seismic views in depth domain (2D line, 3D inline, 3D crossline, 3D slice, Arbitary line, 3D view):
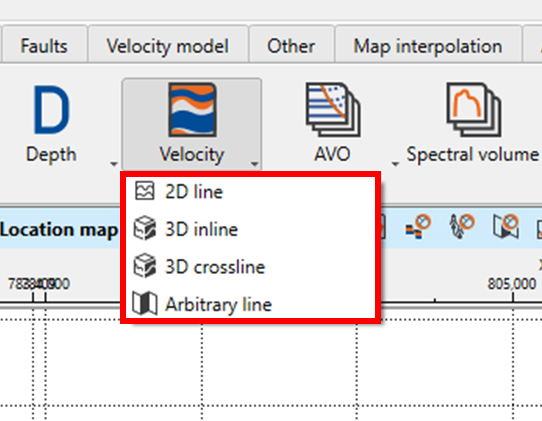
 Velocity - allows to add different velocity views in depth domain that were created by Velocity model building flows or loaded from external sources (2D line, 3D inline, 3D crossline, Arbitary line):
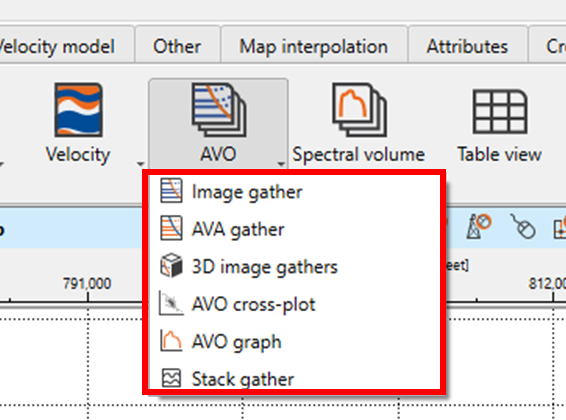
 AVO - allows to add different views for AVO analysis (Image gather, AVA gather, 3D image gather, AVO cross-plot, AVO graph, Stack gather):
 Spectral volume - creates view for spectral analysis
 Table view - allows to create table view for review and edit different types of tabular format data
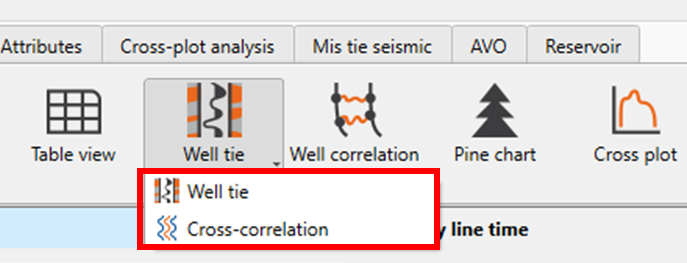
 Well tie - contains two views. Well tie view allows to visualize, analyze and edit loaded checkshot, generate synthetic and perform seismic to well tie flow.
Cross-correlation view visualizes cross-correlation function between seismic and synthetic traces:
 Well correlation - creates a view for correlation and visualization of different types of well data such as continuous and/or discrete log data, point data, comment logs, etc.
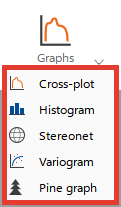
 Graphs - creates views for statistical analysis data, consisting of Cross-plot, Histogram, Variogram, Stereonet, Pine graph, and Tornado.
 GRV - creates a view with a graph for volumetric estimation
![]() Map editor - creates a view for map editing
Map editor - creates a view for map editing