3D seismic data can be visualized in g-Space both on a section or within a 3D window, depending on the interpretation needs. Let’s explore how seismic data is displayed in section and review visual settings that aid in picking geological horizons, faults, and other subsurface structures.
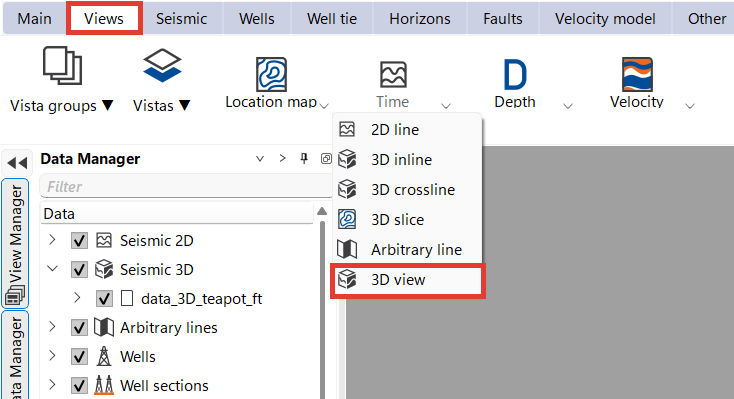
To create a 3D view, go to the Views in the Ribbon Bar, select a Time or Depth scale and a 3D view.
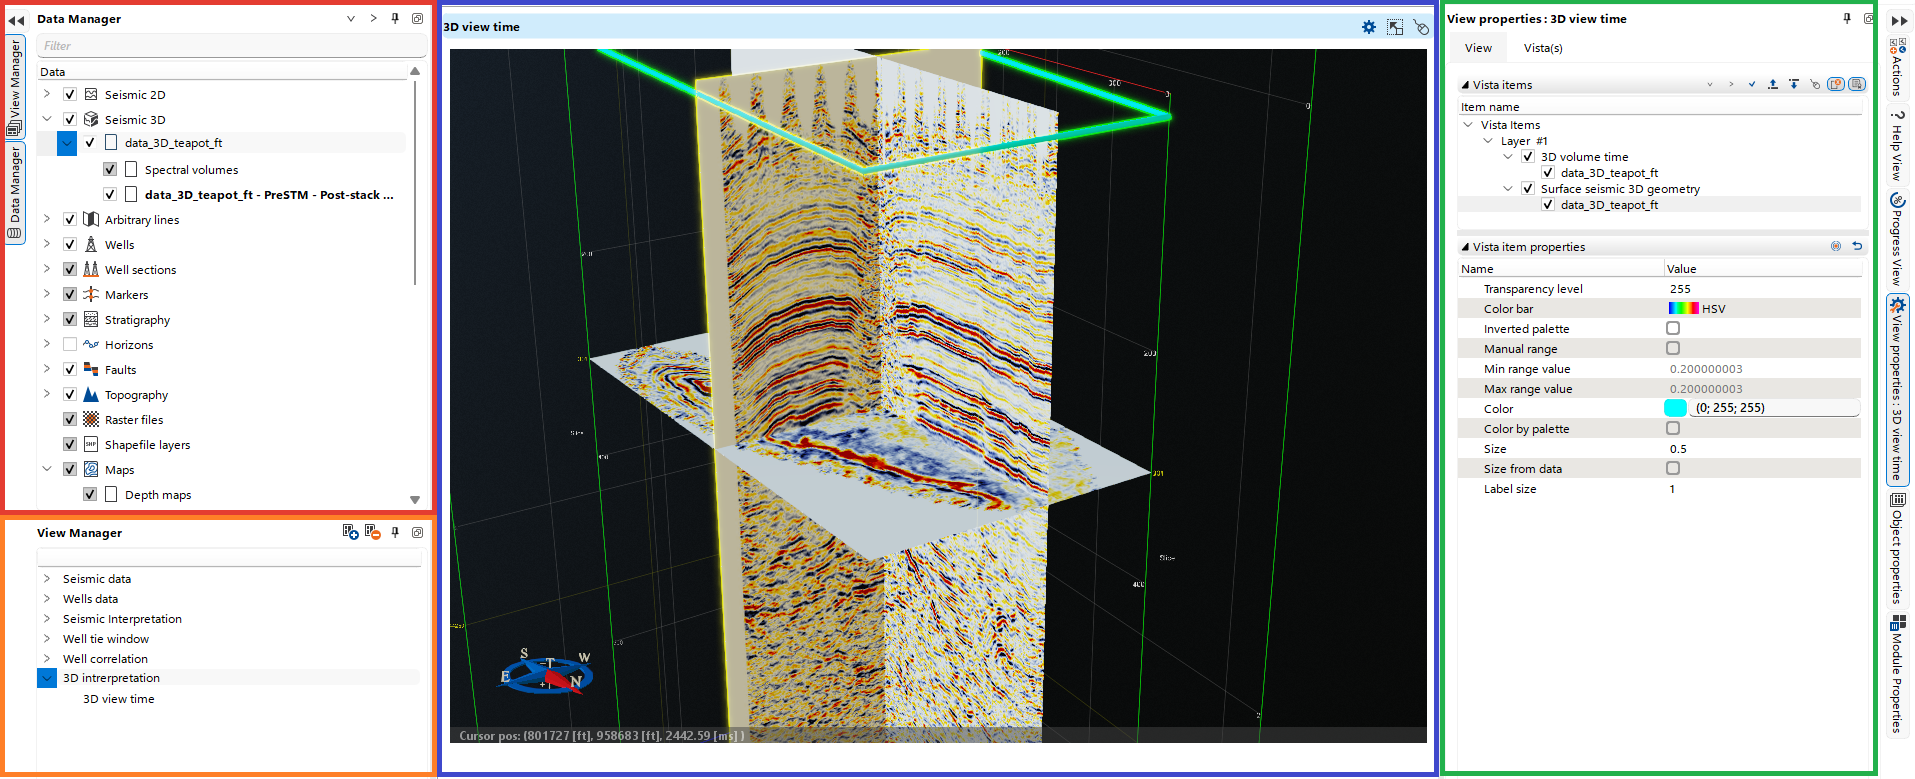
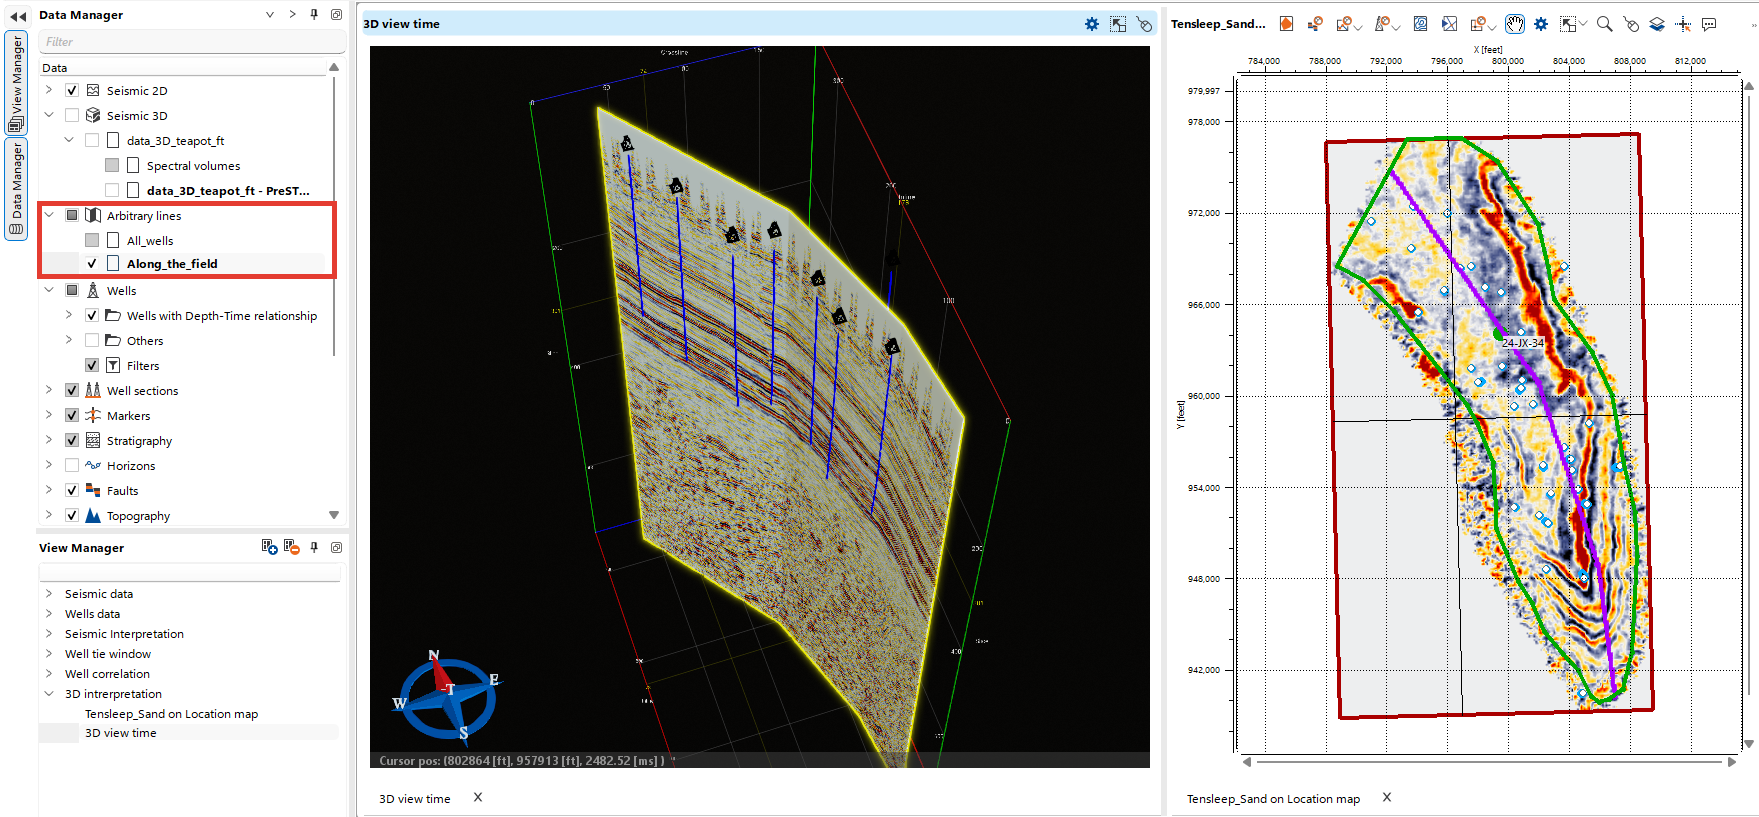
By default, all the data of your project will open in the new 3D view. To turn off visualization, uncheck the boxes in the Data Manager (highlighted in red).
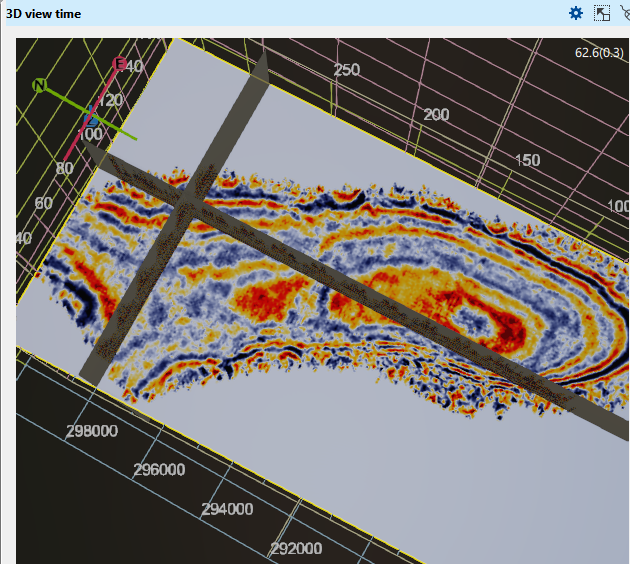
You can view an entire 3D volume or seismic sections and time/depth slices in 3D View.
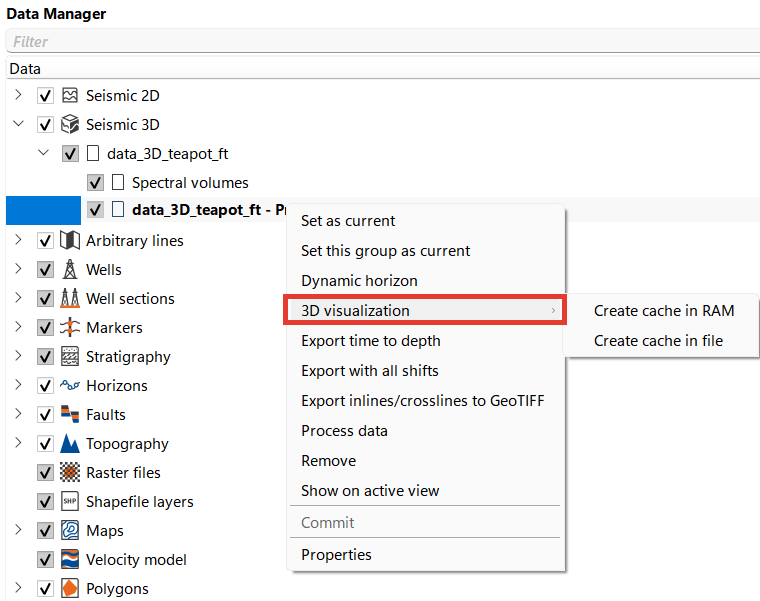
Right click on the 3D volume you want to display, select 3D visualization and create a cache for it in a RAM or file. You can find detailed explanation which path to choose in 3D View
Within the View Manager (highlighted in orange) users have the capability to construct a customized workspace by combining multiple views.
The highlighted blue Workspace displays active views. To add a desired view, navigate to the Views in the Ribbon bar. To close a View, click on the 'x' at the bottom of the view next to its name and confirm your choice.
On the right-hand side, you can find the Settings area. For each active element in the Data Manager, its visualization settings will be displayed in the Visual Settings. To switch to another object, click on it in the Data Manager.
Detailed settings and Hot keys described in chapter 3D View
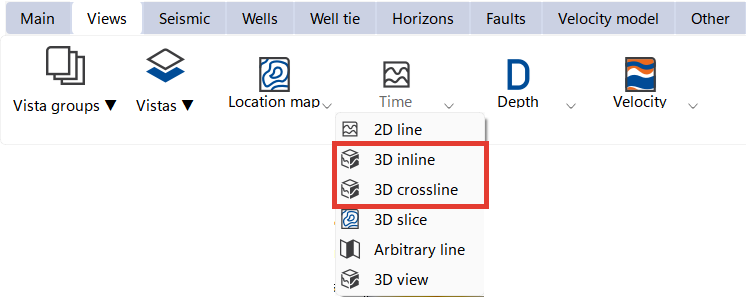
The primary visualization parameters when working with 3D seismic cubes are inlines and crosslines. To create new inlines or crosslines, navigate to the time or depth domain under the Views and select 3D inline or 3D crossline
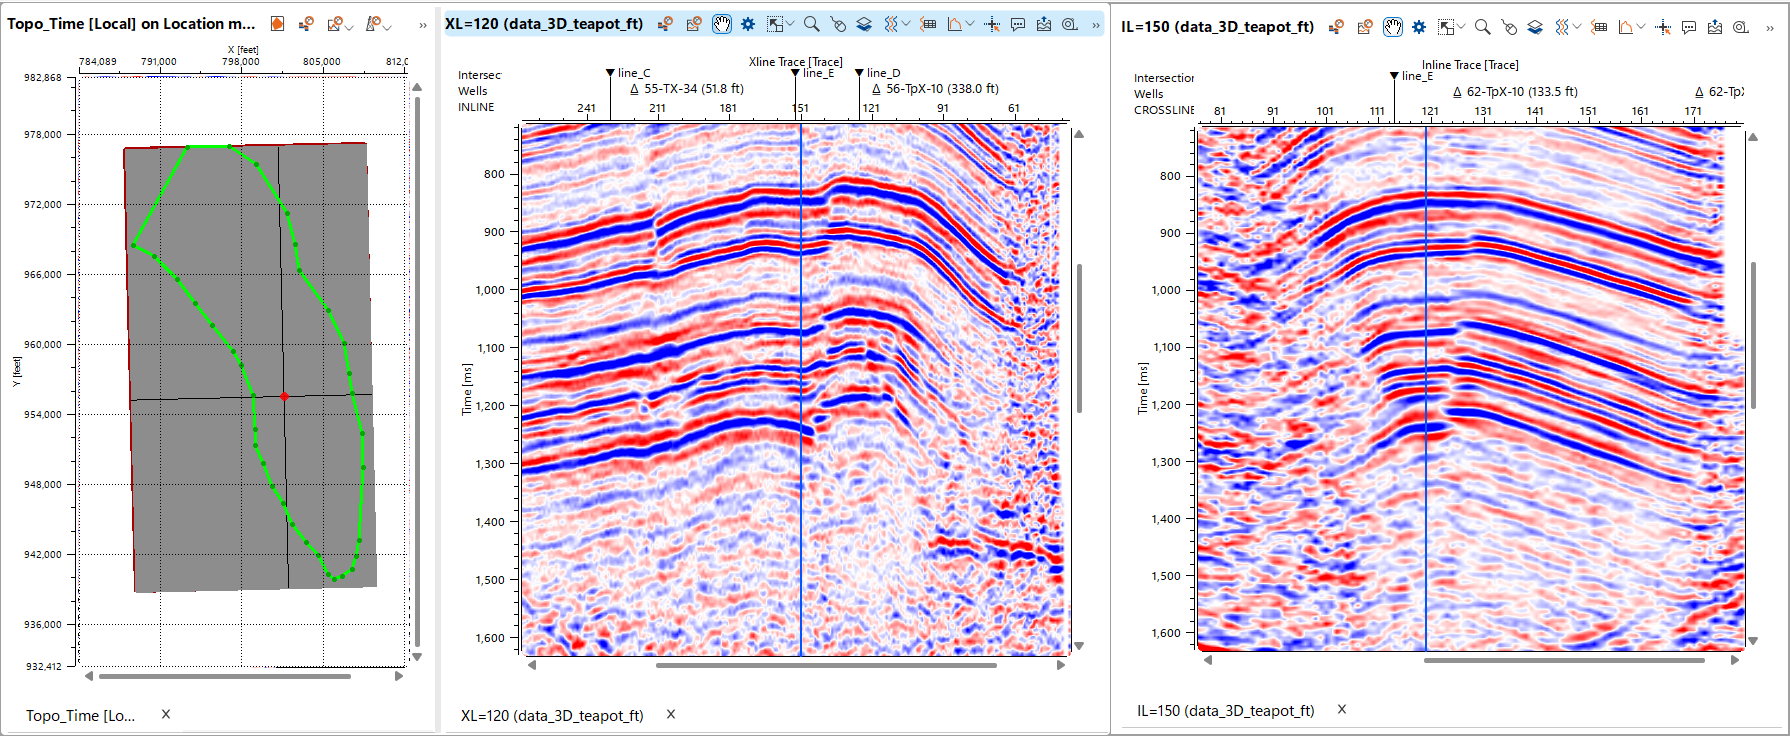
The image below shows the inline and crossline sections, as well as the 3D volume on the Map view with the indicated sections and the intersection point (highlighted in red on map and in blue lines on the sections). It is convenient to visualize inline and crossline views and synchronize them using the Synch feature in the Main Bar.
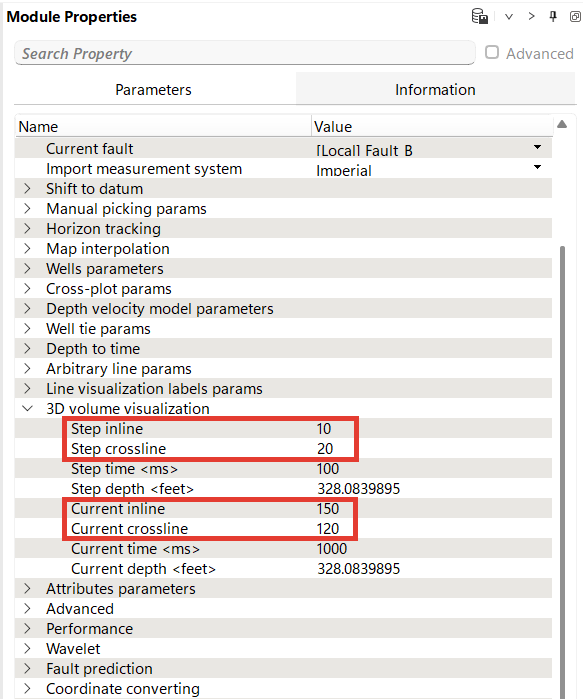
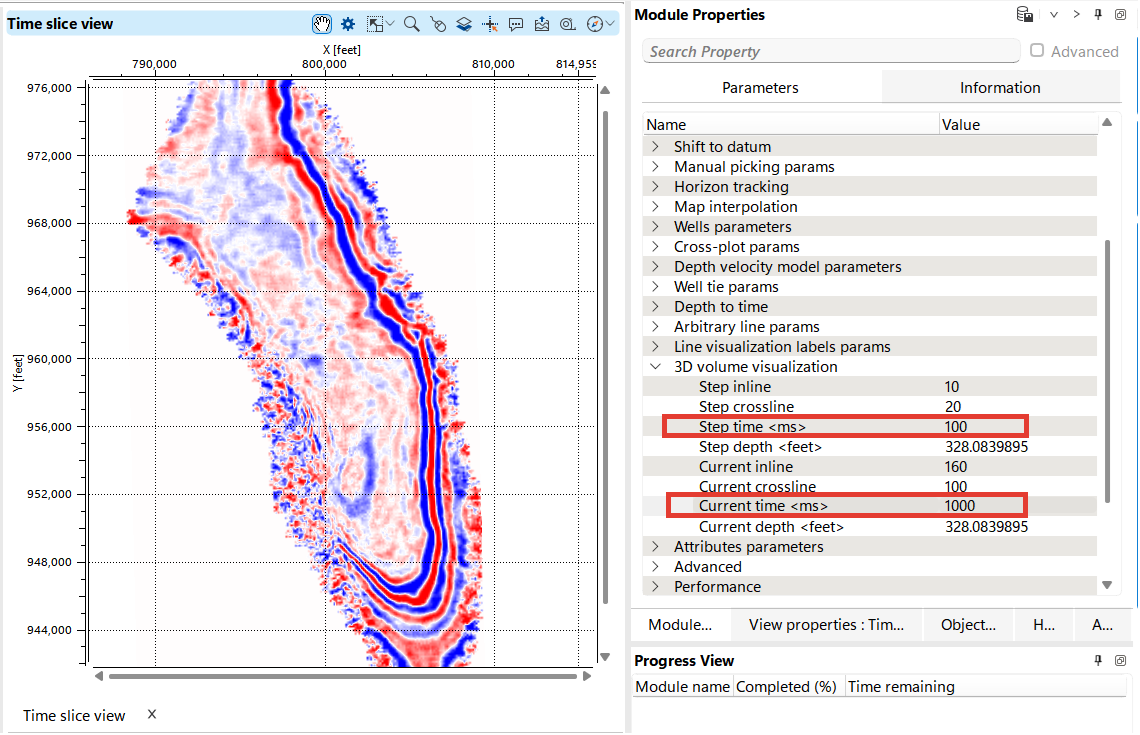
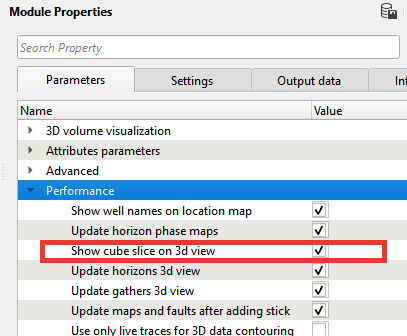
Open the Module Properties panel on the right. Here, you can set the step for switching between inlines and crosslines, as well as view or specify the current value that will be displayed in the view.
Hot keys are available:
Up and Down move the active section up and down in the set scale
Ctrl+Left and Ctrl+Right move crosslines with a set step
Ctrl+Up and Ctrl+Down move inlines with a set step
Or Page Up and Page Down buttons move both inlines and crosslines in the active view
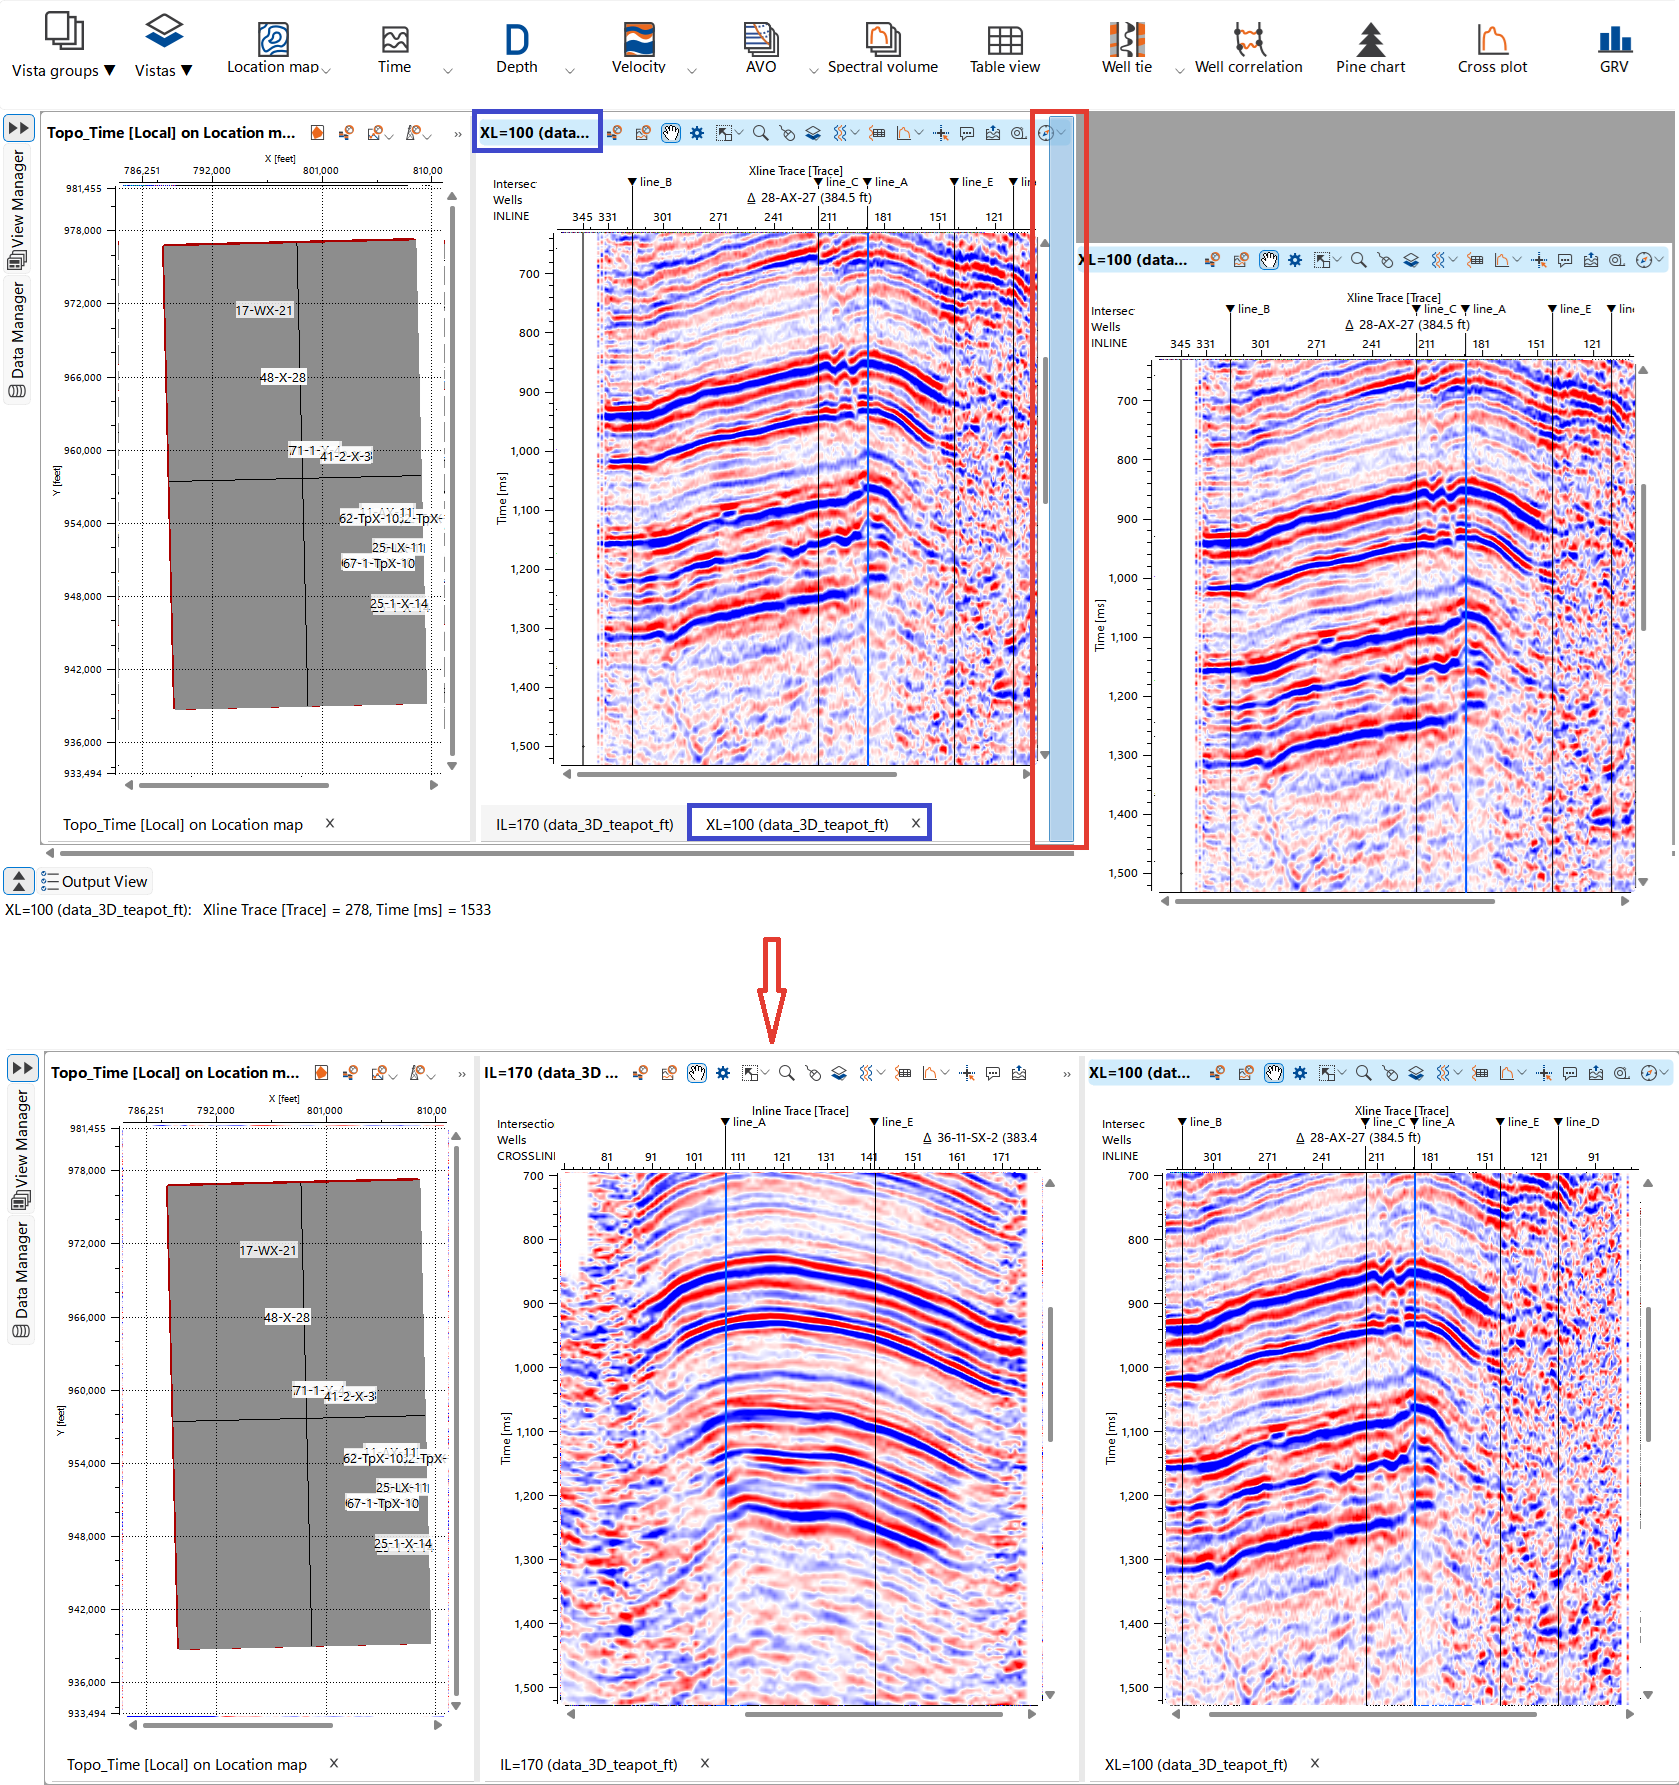
To arrange multiple windows vertically in the workspace, click and drag the view tab (highlighted in blue) to either the top or bottom edge of the window. As you drag, a blue vertical field (highlighted in red) will appear, indicating where the window will be placed. Release the mouse button to align the windows in a vertical order within the workspace.
Similarly, to arrange windows horizontally, drag the view tab to the top or bottom edge of the window. A blue highlighted box will appear, indicating the placement. When held in place, additional layout options will be available. If the entire window is highlighted in blue, you can add the current view as a new tab to the existing view.
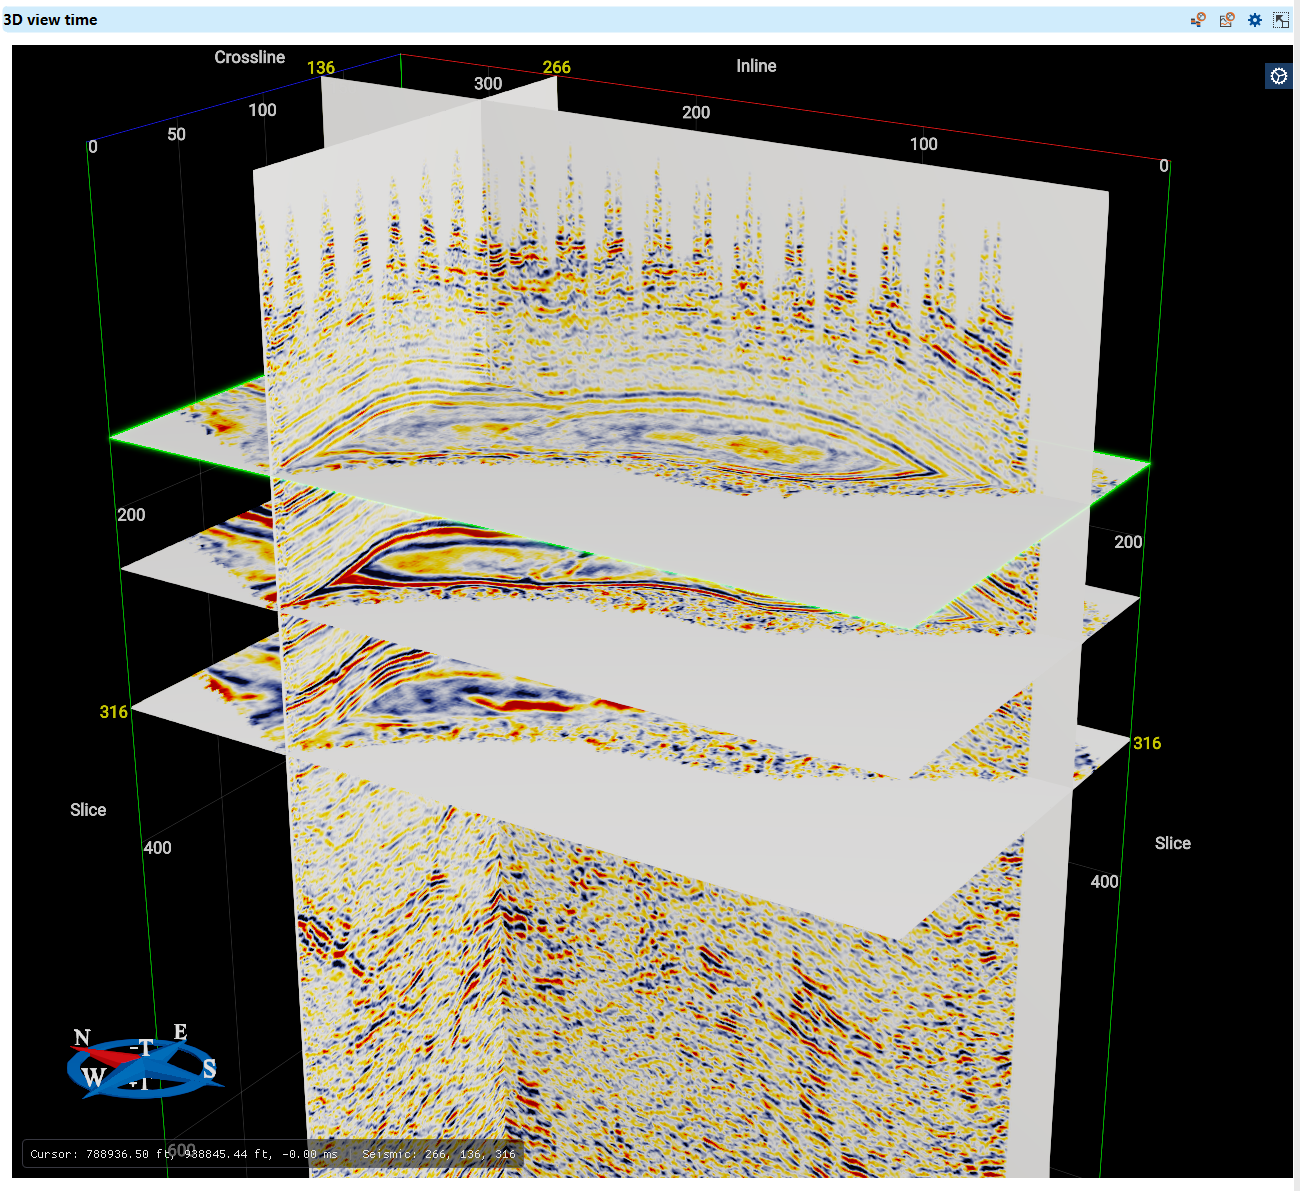
Time or depth slices offer horizontal cuts through the 3D seismic volume, displaying a snapshot of the subsurface at a specific time or depth level. This visualization is particularly useful for analyzing lateral continuity of geological features like channels or reefs.
To generate a time or depth slice in g-Space, go to the Views Bar and select either Time 3D Slice or Depth 3D Slice. Define the specific time or depth level in Module Properties, and adjust the visualization settings to enhance clarity in Visual Settings.
Use hotkeys Ctrl + "+" and Ctrl +"-" to switch up and down the seismic volume
Using the Up, Down, Left and Right keys you can move the image within the view.
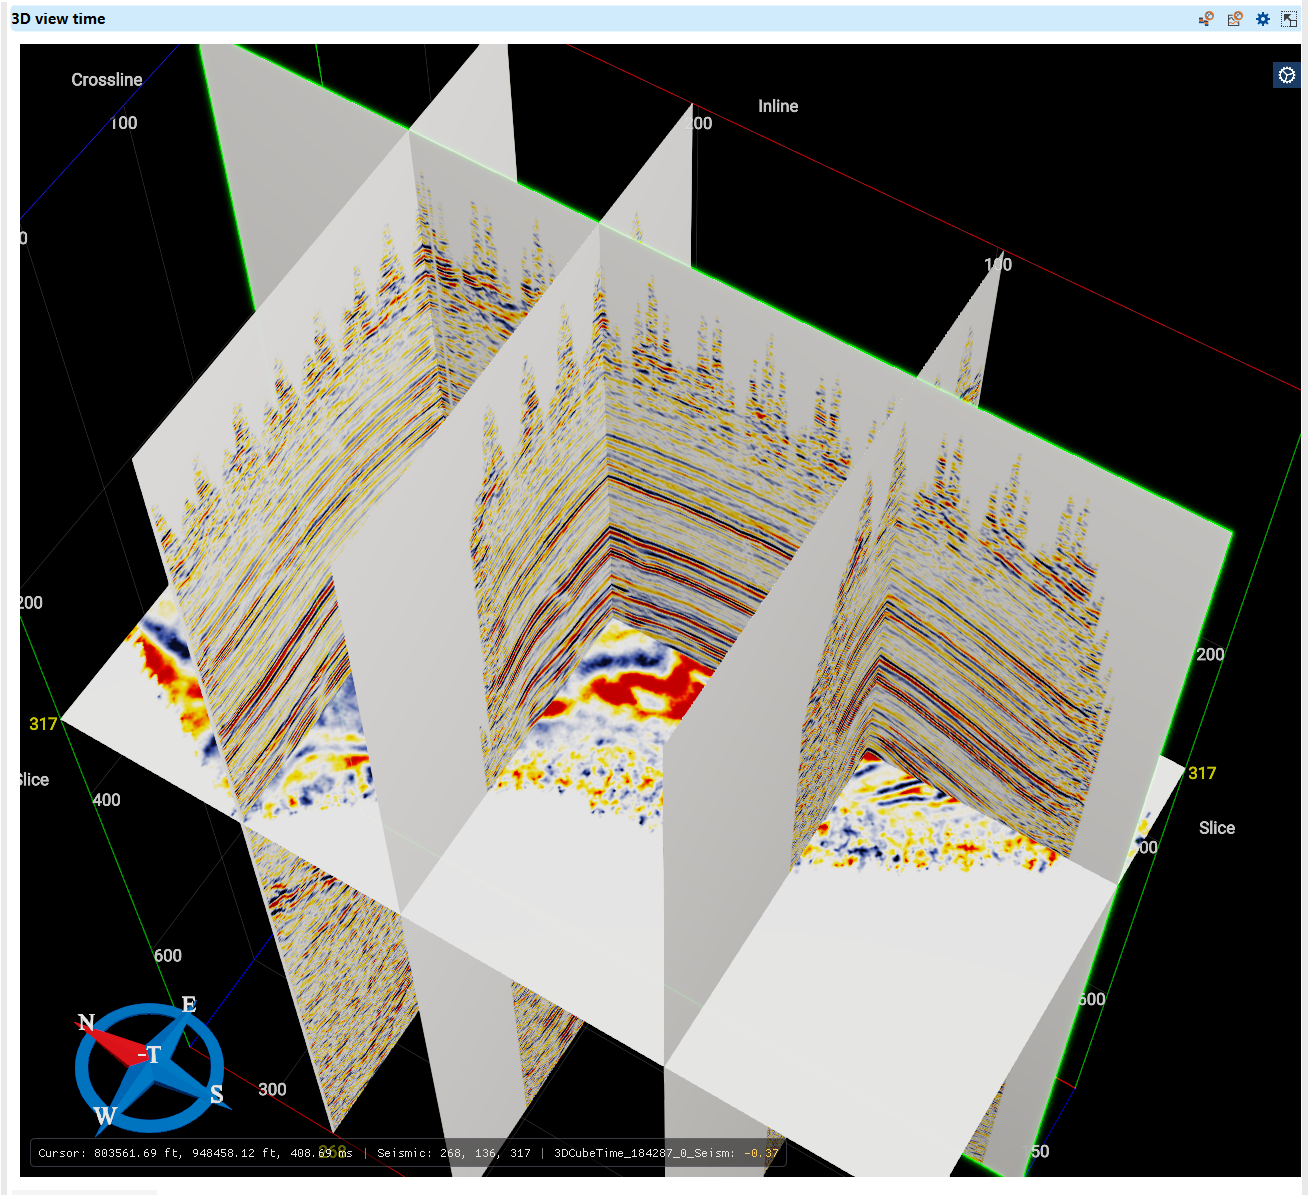
In 3D View it is convenient to visualize the seismic volume as 3 planes - inline, crossline and time slice.
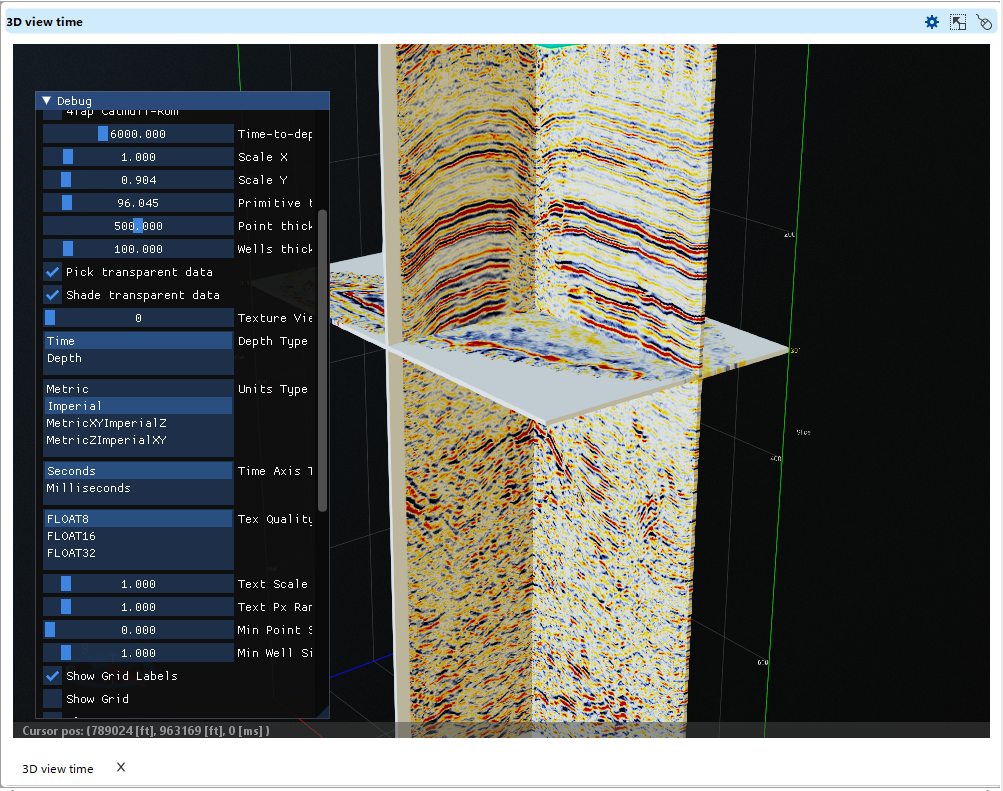
The settings menu is accessible via the gear icon in the upper right corner.
To create additional sections, use the L key.
While the cursor is positioned on the active section (Inline or Crossline), press L. A new section will be created perpendicular to the currently active one.
For example:
•If an Inline section is active, pressing L creates a new Crossline at the cursor position.
•If a Crossline section is active, pressing L creates a new Inline at the cursor position.
The new section is generated at the exact location where you click within the active view.
For removing them click Delete.
For additional slices click S key.
Check Tab Parameters in Module Properties Panel for visualization and objects settings
Using the Arbitrary Line Tool in g-Space
Arbitrary Line is particularly useful in the following scenarios:
•Comparing 2D and 3D Data: This tool is essential for comparing and assessing the quality of different seismic surveys. By creating custom lines that traverse both 2D profiles and the 3D seismic volume, users can directly compare the resolution and continuity of seismic reflections, leading to a better understanding of the subsurface. A detailed description is available in the 2D data chapter.
•Correlating Wells: The arbitrary line is helpful for correlating wells, especially when you need to understand the structural and lithofacies features of the interwell space. By drawing a line that connects multiple wells, you can visualize how stratigraphic horizons and structural features change between wells.
•Tying Directional Wells: When dealing with directional or deviated wells, the arbitrary line allows you to create cross-sections that follow the wellbore trajectory. This aids in accurately tying the well data to seismic data, ensuring a more precise integration of well and seismic interpretations.
•Analyzing Geological Structure: For fields with complex geological features, such as the anticline fold in the Demo project, the arbitrary line tool is particularly useful for analyzing geological structures both along and across the fold axis. Given that the fold has a curved structure relative to the geometry of the seismic survey, arbitrary lines enable a more flexible and accurate examination of the fold’s features, which might not align with standard seismic lines.
Creating Arbitrary line using wells location.
In the Data Manager, create a new Arbitrary line and name it.
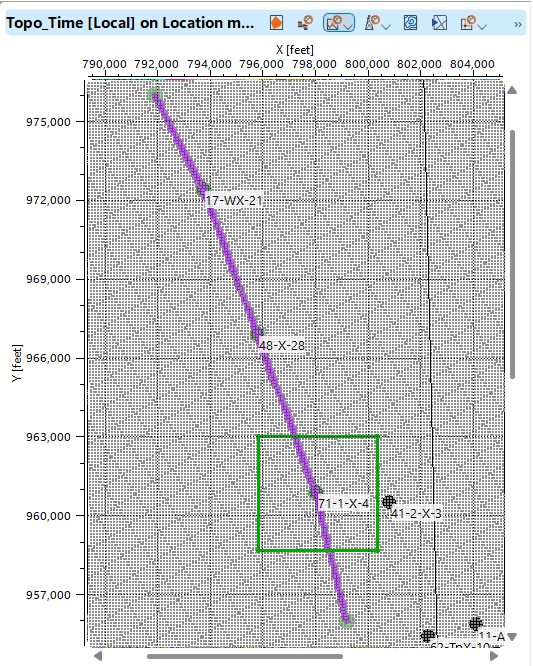
Visualize the wells and 3D seismic in the Map window. From the top menu, select the 3D arbitrary line tool and draw the line through the well locations. Depending on your objectives, you may find it useful to visualize either the wellheads or the projection of the entire well trajectory.
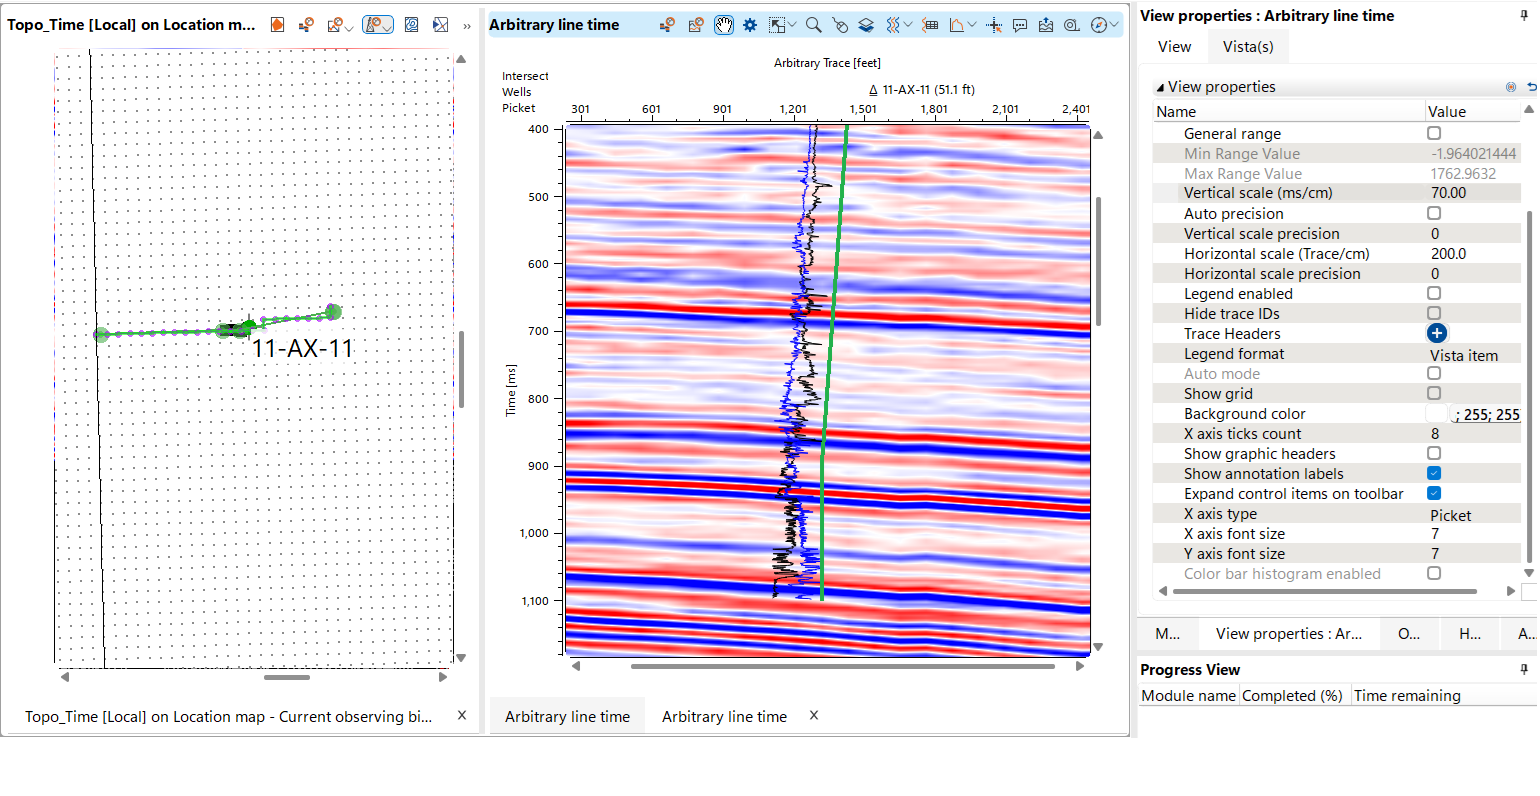
To remove points from the arbitrary line, hold down the right mouse button and select the unwanted point(s) (highlighted by a green polygon).
On the created arbitrary line, you can visualize well data, including well trajectories or vertical projections of the wellheads. Additionally, it's possible to display logging curves and synthetic traces for further analysis.
To display wells in the time domain, the user must have a checkshot.
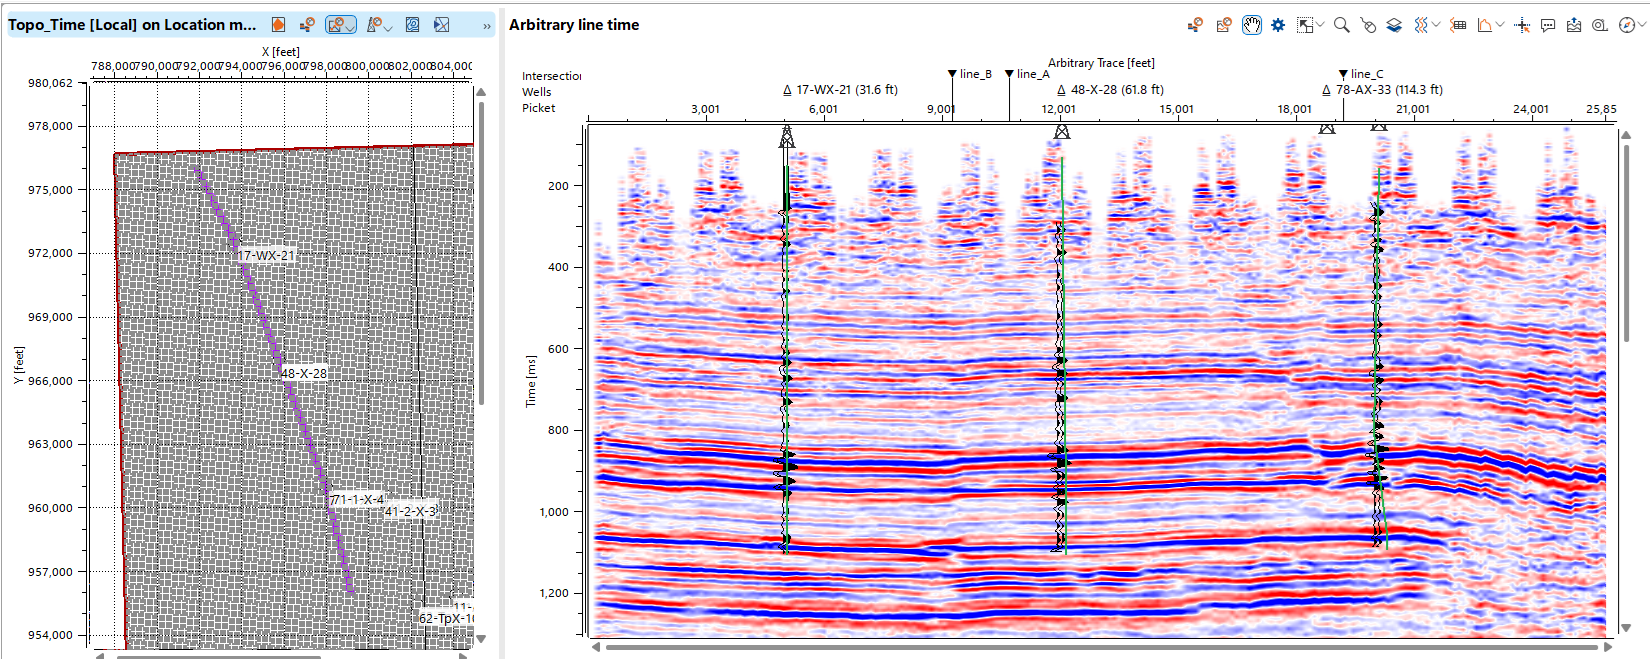
To display an arbitrary line in 3D View, open the Time/Depth 3D View. In the Data Manager, select the arbitrary line(s) you wish to visualize.
To display a seismic section along a deviated well, it is useful to create an arbitrary line with such a geometry that the trajectory lies within a single plane.
g-Space supports the creation of multi-panel displays where you can visualize different types of views (e.g., inline, crossline, time slice) simultaneously. This setup provides a more comprehensive interpretation workspace.