Stereonet analysis is a powerful tool for visualizing structural data, such as dip and azimuth measurements, to analyze geological orientations and patterns.
Import LAS file containing Azimuth and Dip values into g-Space.
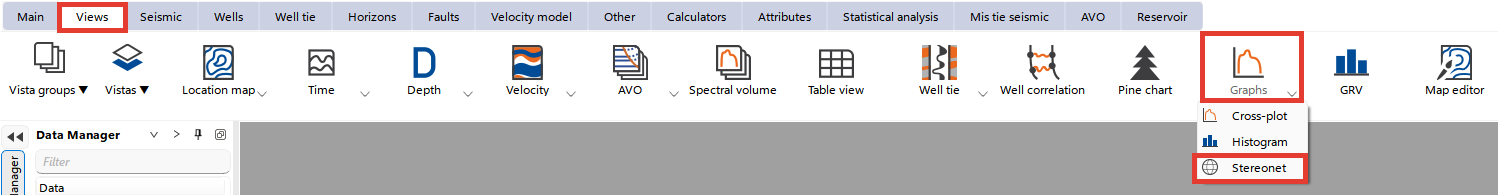
Go to the Views bar in the Ribbon bar. Choose Graphs - Stereonet
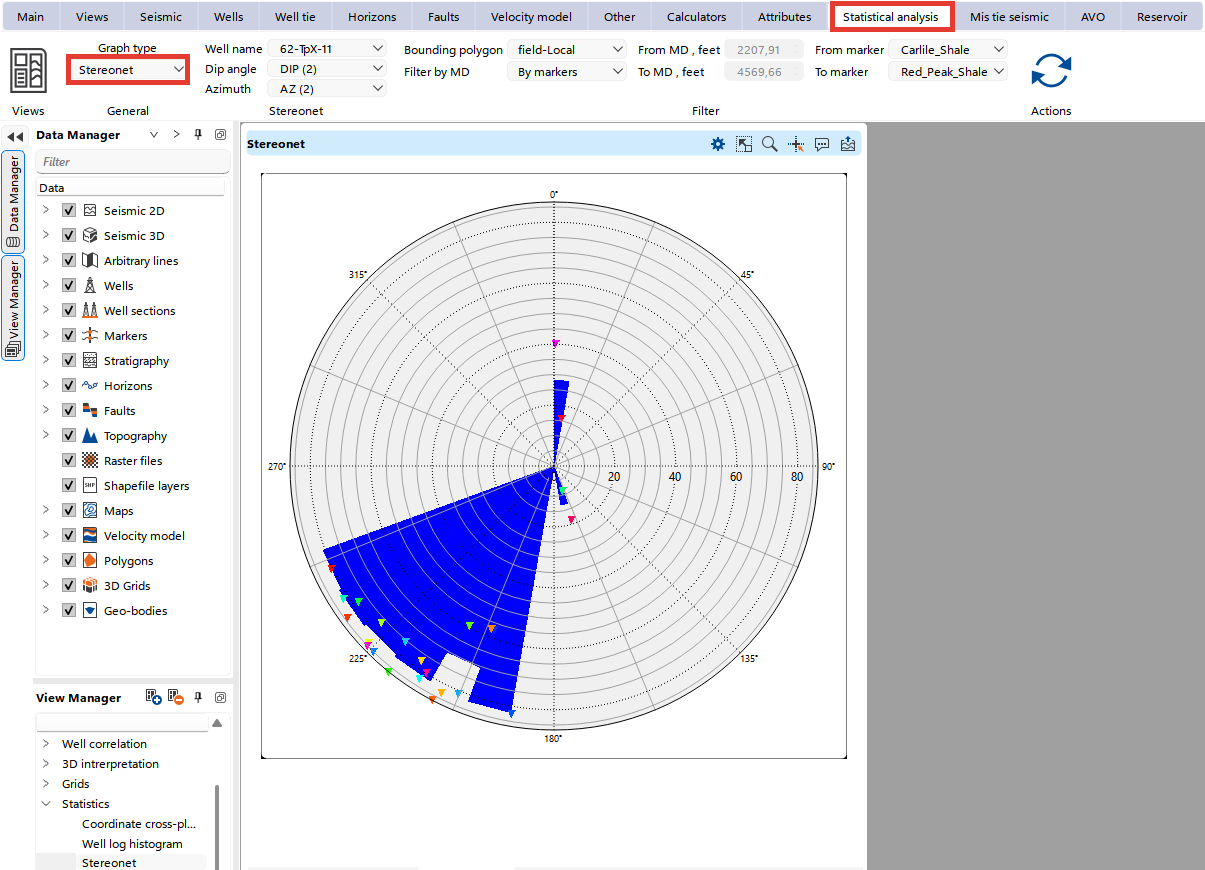
In the Statistical analysis bar for Stereonet graph select your LAS data columns for Dip (inclination angle) and Azimuth (horizontal angle).
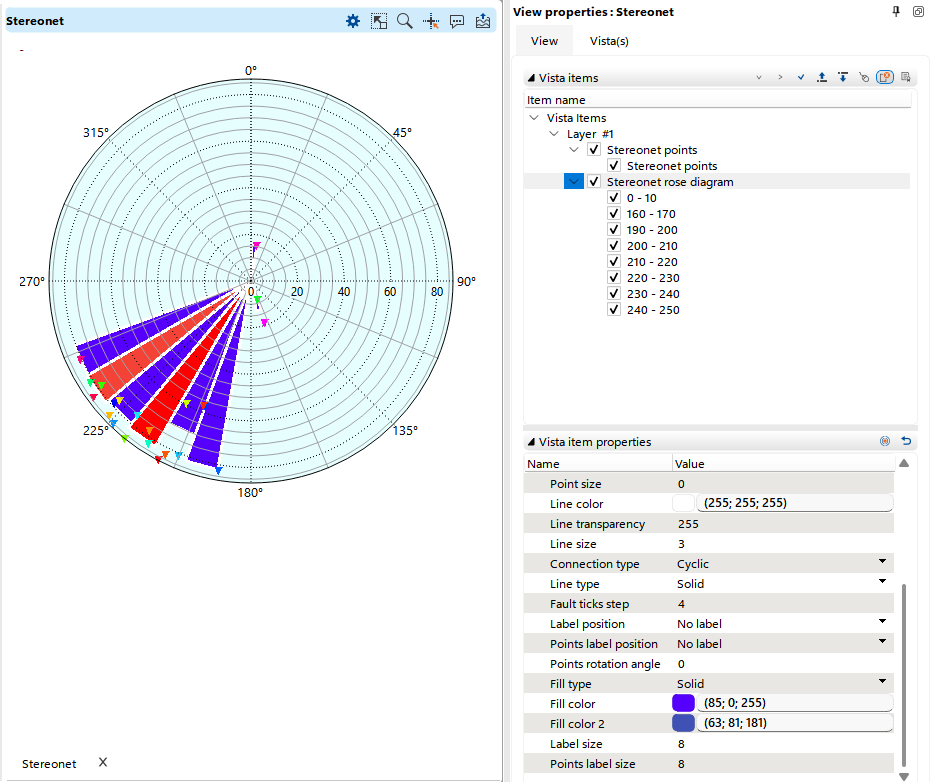
Visual Settings
Users can customize the Histogram display for better interpretation:
Line and Rose Diagram Colors: Set custom colors for lines and the rose diagram to enhance clarity.
Depth-Based Color Palette: Visualize points based on depth using a color palette.