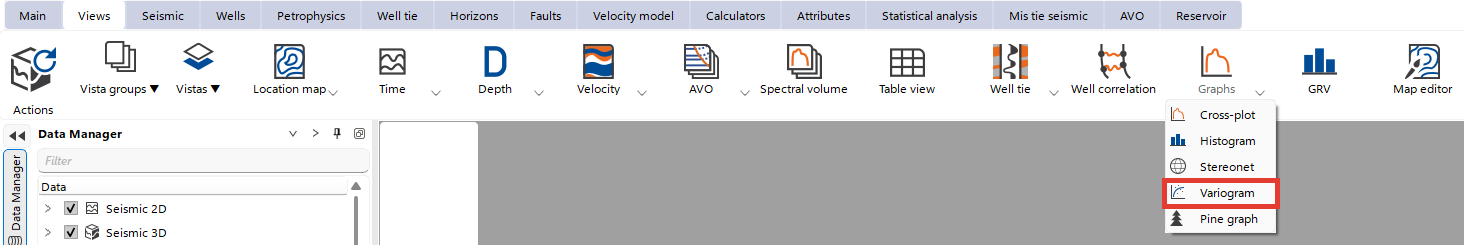
To create Variogram view go to the Views bar, navigate to Graphs and click on Variogram button:
To start variogram analysis, navigate to to the Statistical Analysis bar and select the Variogram option under the Graph type dropdown menu.
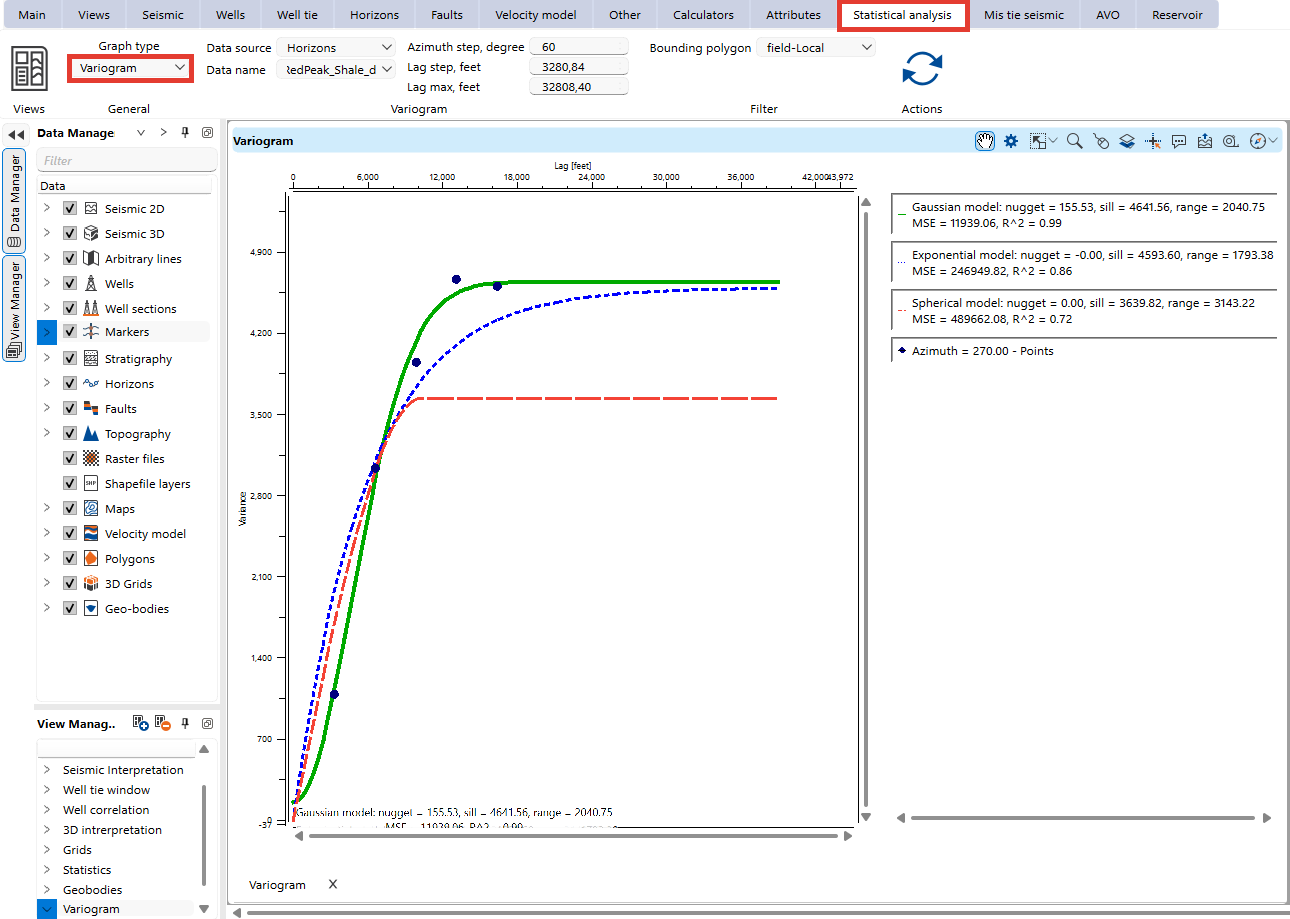
In the Visual Settings panel, users can adjust visual settings for better interpretation:
•Transparency levels
•Color schemes
•Line types and thickness
•Point size and shape
Users can also enable or disable specific models to focus on relevant data trends.