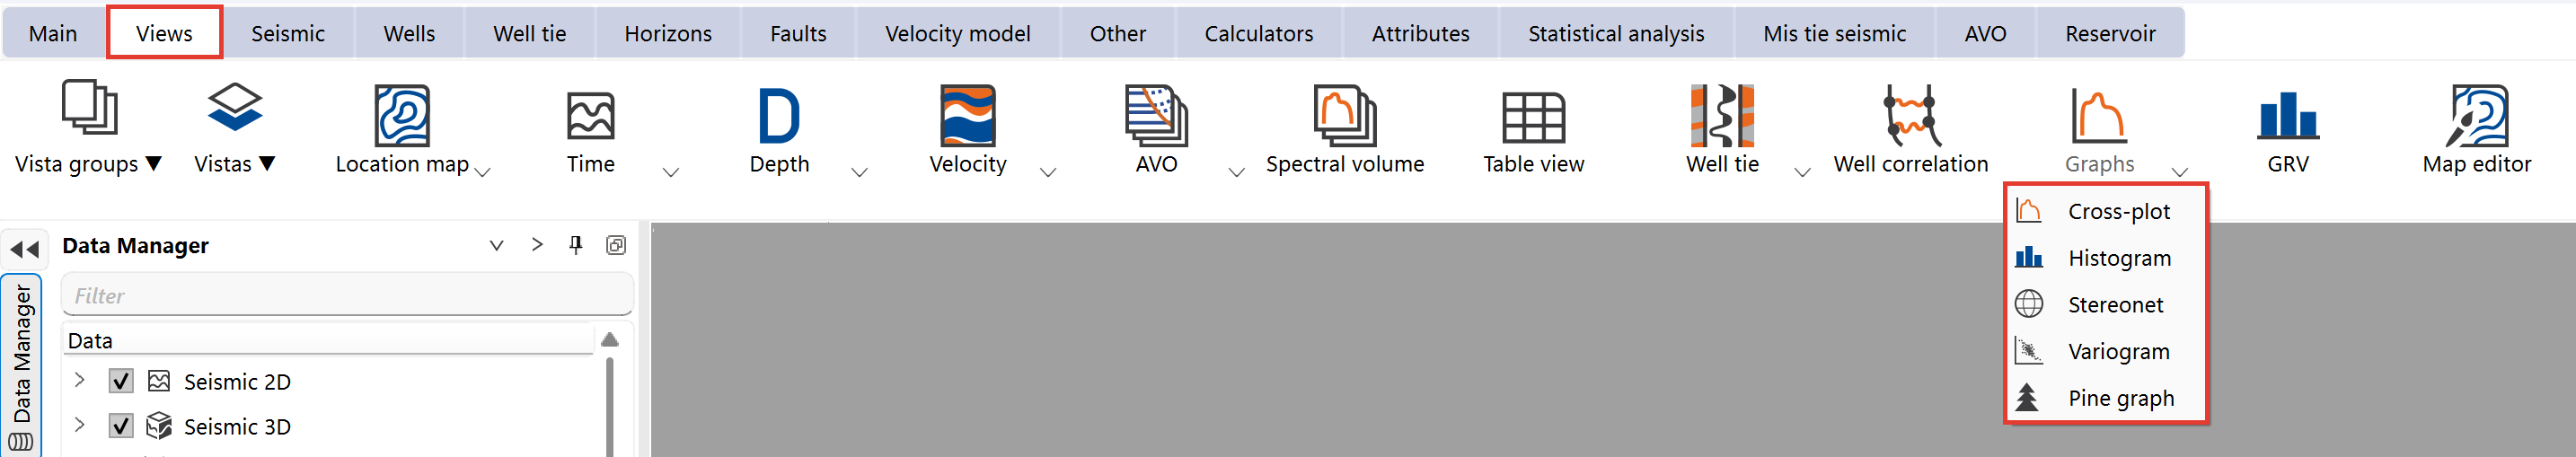
The Graphs section in the Views bar provides tools for visualizing and analyzing relationships within your data. It includes three main graph types:
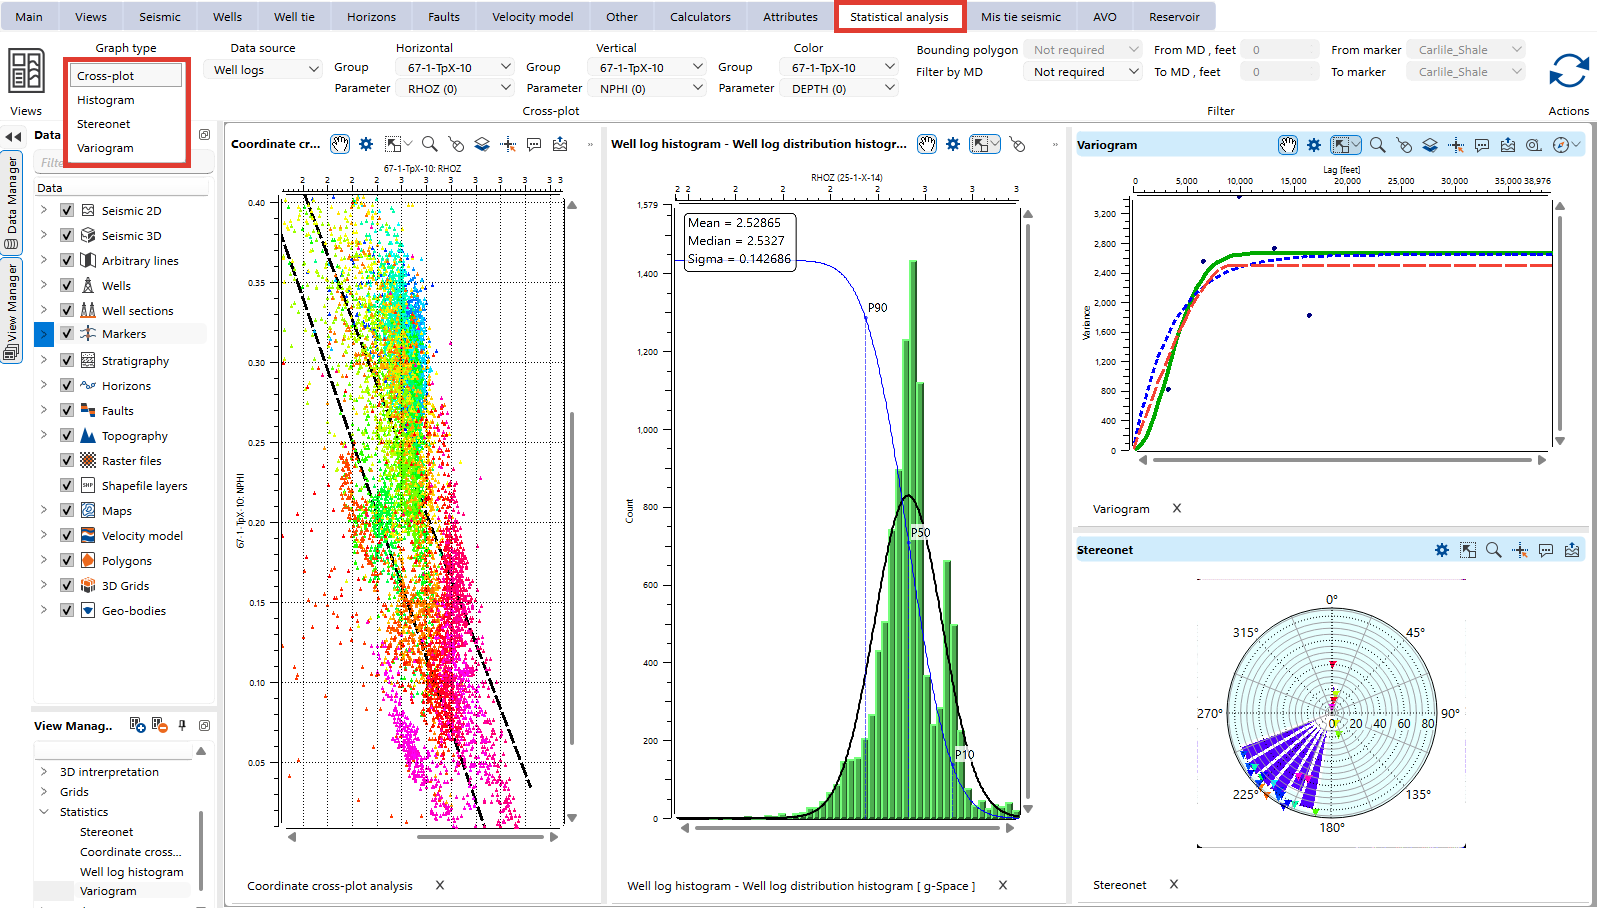
1.Cross-Plot: Visualize the relationship between two selected attributes plotted on the X and Y axes. This is particularly useful for identifying trends, correlations, and patterns in the data.
2.Histogram: Display the frequency distribution of well log data. Use histograms to analyze data ranges, identify dominant values, and detect outliers in well attributes.
3.Variogram: Visualizes spatial continuity by plotting semivariance against lag distance, aiding geostatistical analysis.
4.Stereonet: Plot structural orientations, such as dip and azimuth, on a stereographic projection. Stereonets are especially valuable for analyzing geological structures, such as faults, bedding planes, and stress orientations.
Configure the graph settings, such as data source, parameters, and filtering options in the Statistical analysis bar.