To access the Velocity model QC tool navigate to the Views and
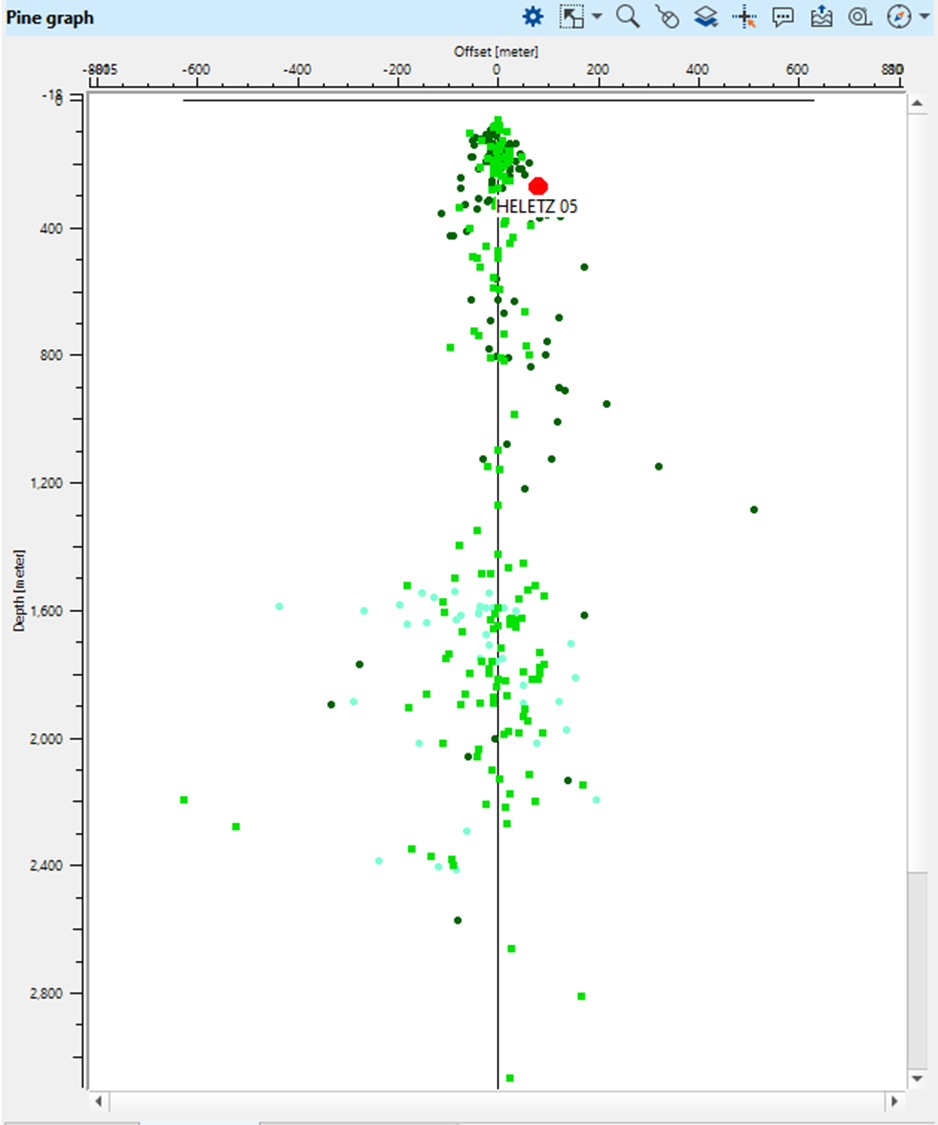
The Pine chart tool allows users to visualize and compare the velocity model with well data in a two-dimensional space. The chart is structured as follows:
•X-Axis (Offset): Represents the distance from
•Y-Axis (Depth): Indicates the depth of the geological layers, which is essential for correlating seismic data with subsurface features.

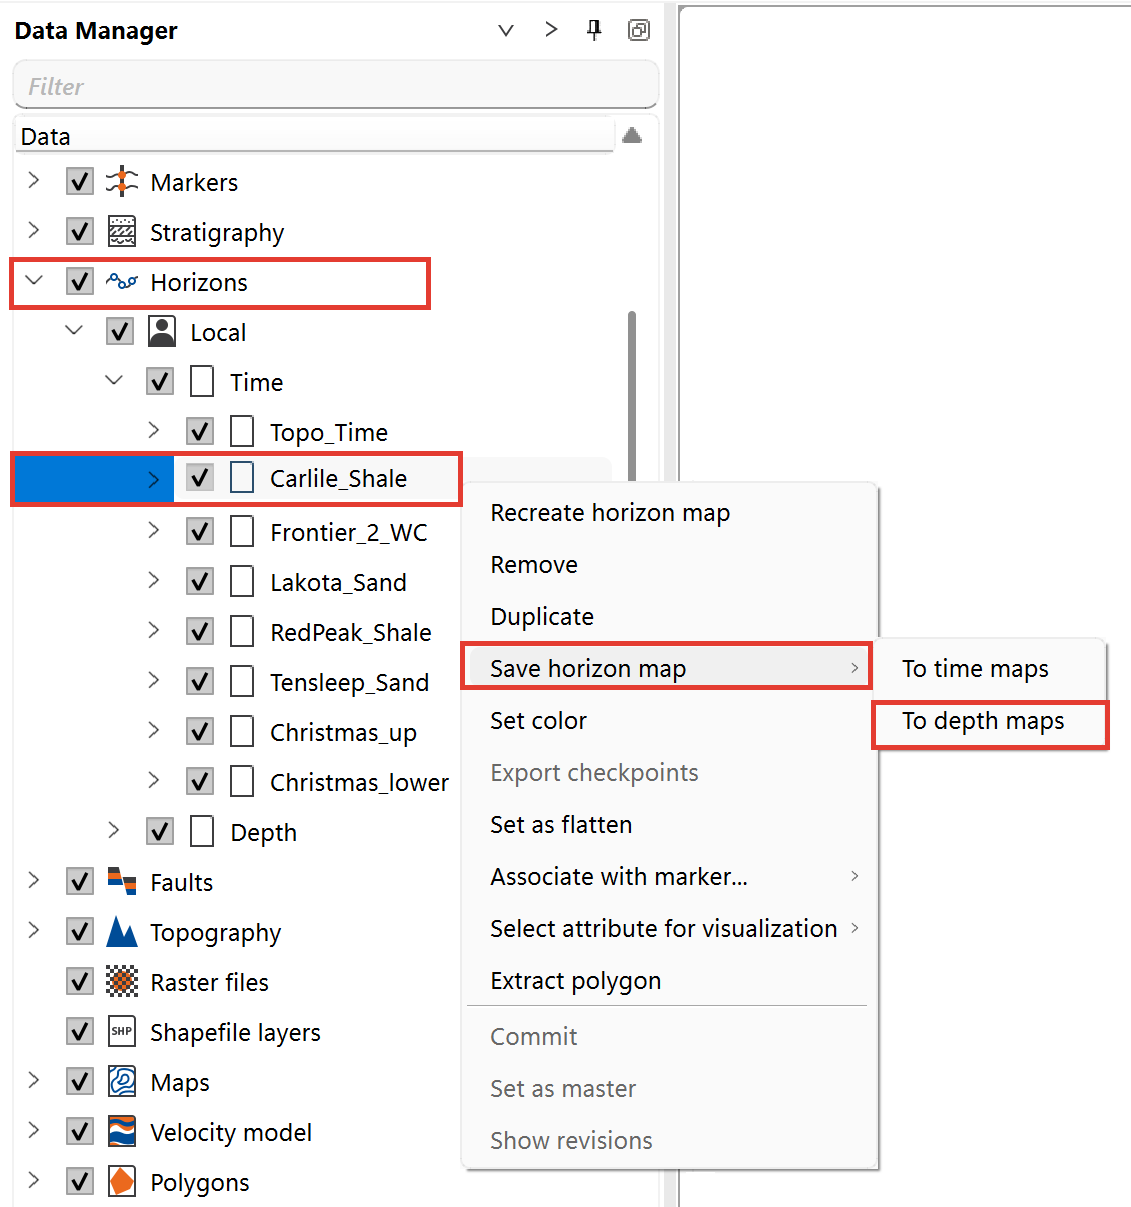
To compare depth horizons in the 3D view using different velocity models, you can convert time horizons to depth maps based on the currently active velocity model. Depth maps are stored in the Maps folder in the Data Manager.
To perform this comparison:
1.Set the active velocity model.
2.Convert the time horizon to a depth map.
3.Change the active velocity model.
4.Repeat the conversion process for the same time horizon.
This workflow allows you to visualize and compare depth variations resulting from different velocity models directly in the 3D view.