Working with Markers in Well Correlation
1.Creating and Managing Marker Sets:
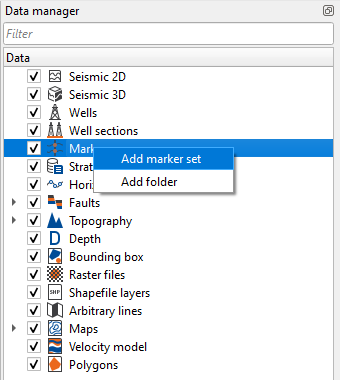
In the Data Manager, right-click on the Markers icon and select "Add Marker Set" to create a new set. Marker sets allow you to organize markers by stratigraphic sequence, lithology, or other criteria, facilitating more effective correlation.
2. Adding and Editing Markers:
Once a marker set is created, you can add individual markers by specifying their depth or time position.
You can also adjust marker positions, correct any inaccuracies, and delete markers as needed.
Markers can be grouped to represent specific intervals or sequences, further enhancing the clarity and usefulness of your correlation.
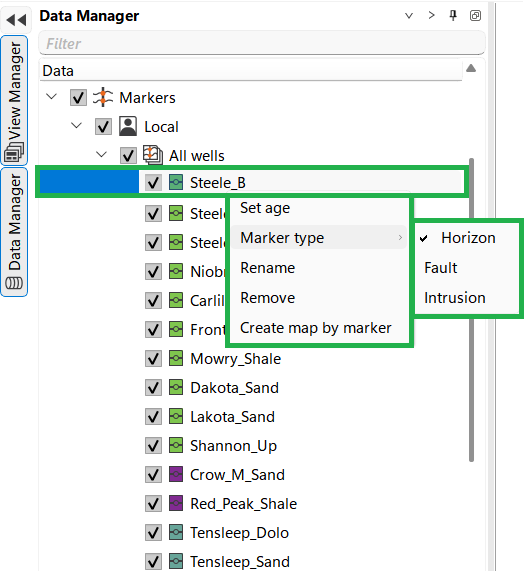
To access the marker settings in the Data Manager, stand on the marker and right-click. This will open a menu where you can adjust the age, specify whether the marker represents a horizon, fault, or intrusion, rename or delete the marker, and create a map based on it.
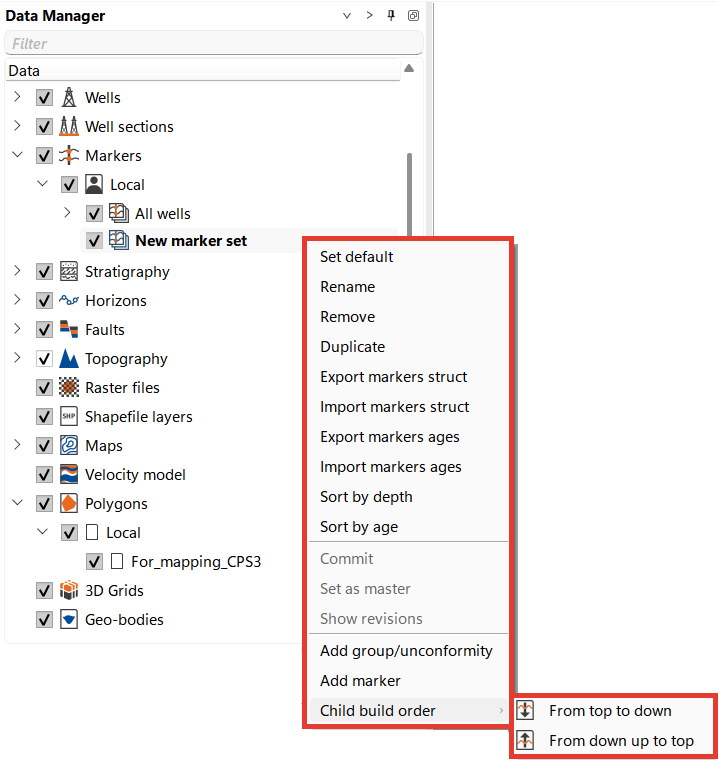
To configure a Marker set, right-click on it to open an expanded menu of options.
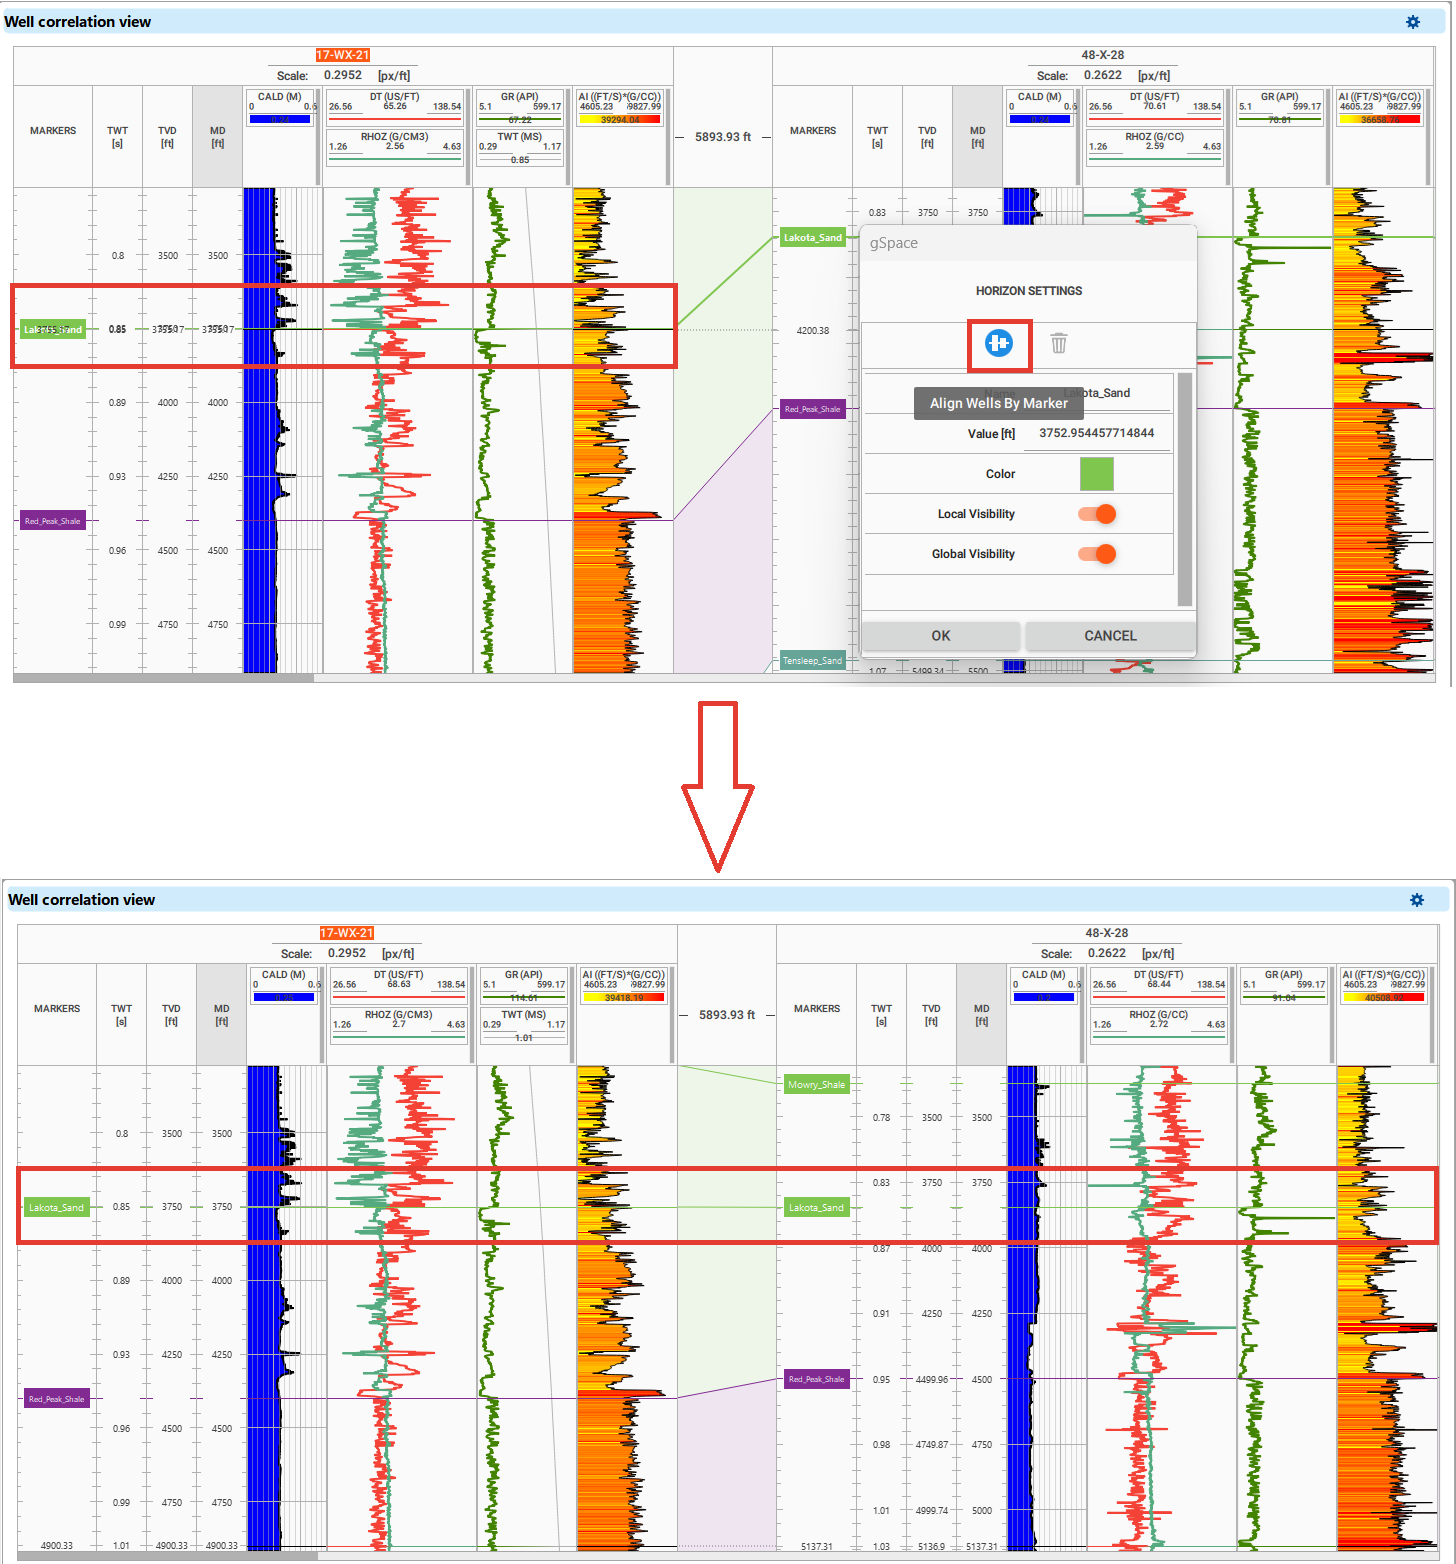
When performing correlation, it is often convenient to flatten the entire correlation scheme with a boundary.
To activate flattening, move the cursor to the desired marker. When the two-way arrow appears, the selected horizon line becomes bold, right click and open the horizon settings menu, click the first icon, highlighted in red in the picture, and the correlation diagram will align with the selected horizon. For this functionality "F" hot key is also available.
To switch between horizons, make the desired horizon active and press the "F" key again. To exit flattening mode, left-click in the axis field and press the "F" key once more. The horizons will then return to displaying their actual depth values.
To exit horizon selection mode, press the Escape key.
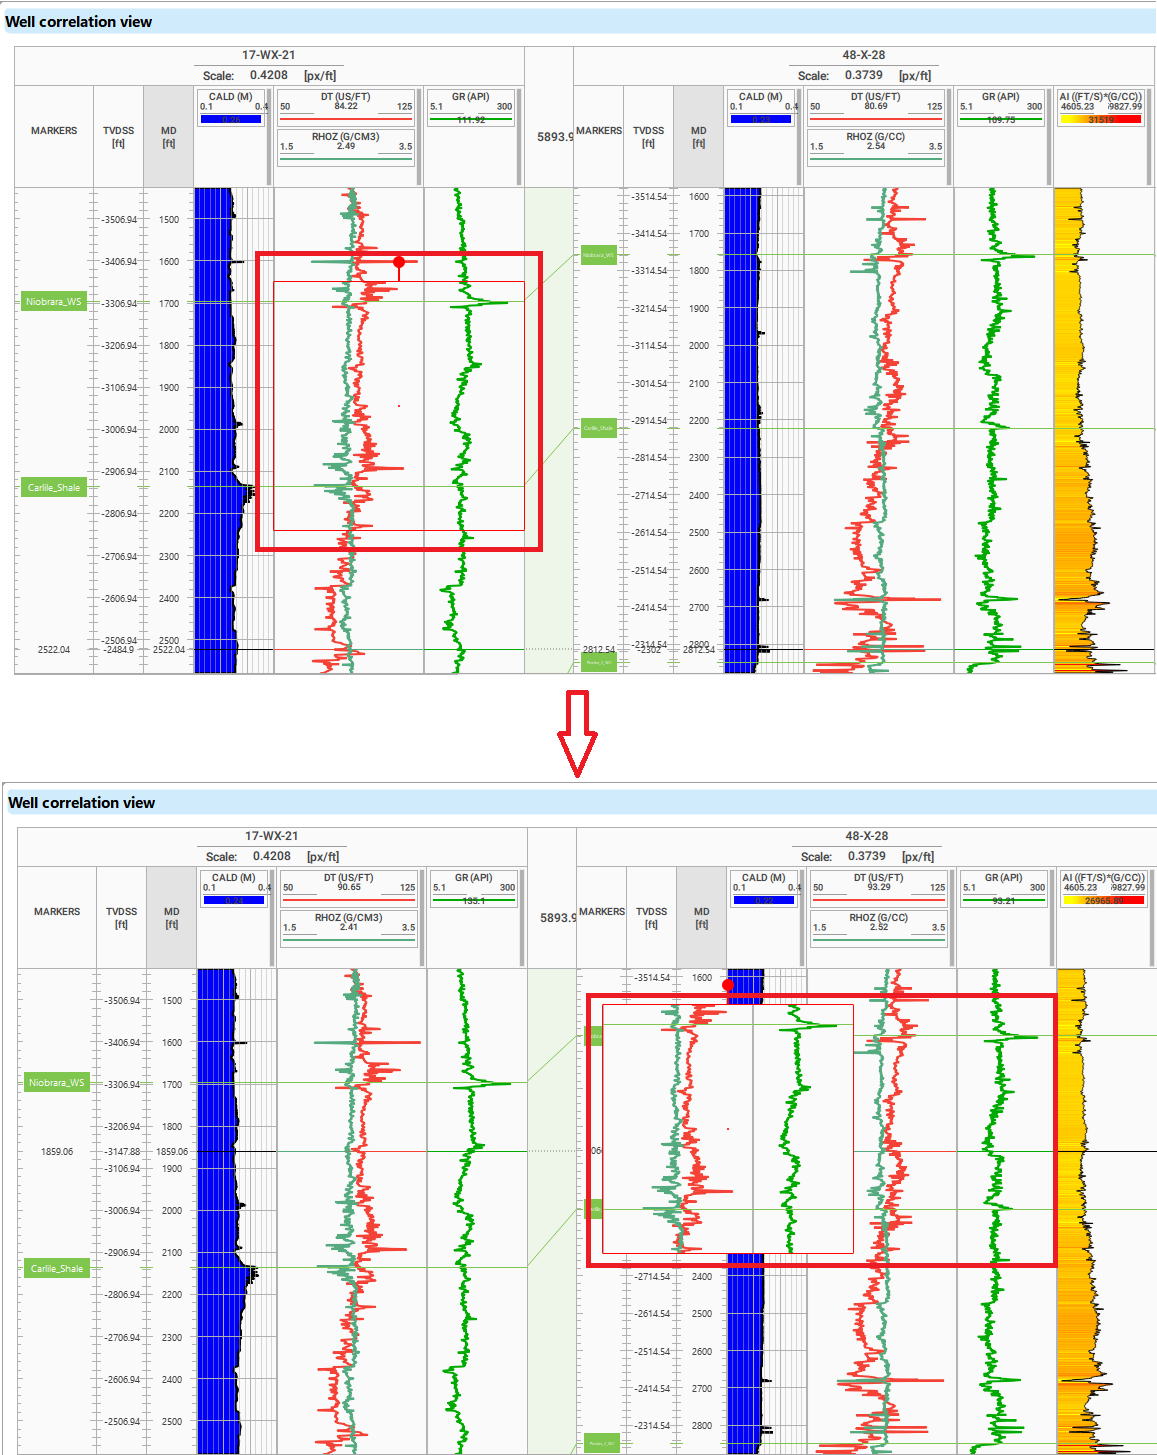
It's often helpful to compare the curve trajectory of one well with others. since the correlation is carried out from key wells with known markers to new ones. To facilitate this, you can use the "Ghost Curves" feature.
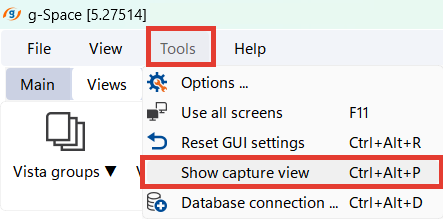
Navigate to the Main menu, select Tools, and then choose Show Capture View. Highlight the section of the screen you wish to compare and drag it to the desired location. To exit this mode, simply press Escape.
During well correlation, you might need to adjust the position of markers as you refine your geological model. To add or change marker positions:
1.Adding a Marker: Click on the desired well log at the depth or time point where you want to place a marker. A new marker will be created at that position.
2.Changing Marker Position: To adjust an existing marker, click and drag it to the correct position within the well log. When you move the cursor close to a marker line, the cursor changes to a double-headed arrow. At this point, the horizon you click on will be highlighted, and its name will be displayed. Ensure the marker accurately represents the stratigraphic horizon or boundary you are correlating.