Well log calculator
The well log calculator creates or updates a curve in one well by applying a mathematical expression to existing log data. In the Data Manager, right-click the target well and select Open well log calculator.

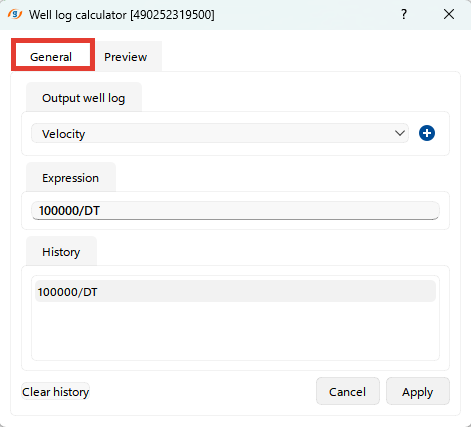
The wizard consists of two main tabs: General and Preview.
In the General tab, users can define the core parameters for the calculation process. It contains the following key components:
- Output well log: Users can either select an existing well log curve from the dropdown menu or create a new curve by naming it. This output will store the results of the calculation.
- Expression: This is the central area for performing operations. Users must input an arithmetic expression using the available well log curves (e.g., porosity, density) and mathematical operators. Expressions can be as simple or complex as needed, enabling flexibility in creating derived curves. Refer to the Trace Headers Math for a description of the available mathematical functions.
- History: g-Space automatically saves previous expressions, making it easier for users to reapply calculations they have used in the past without having to rewrite them.
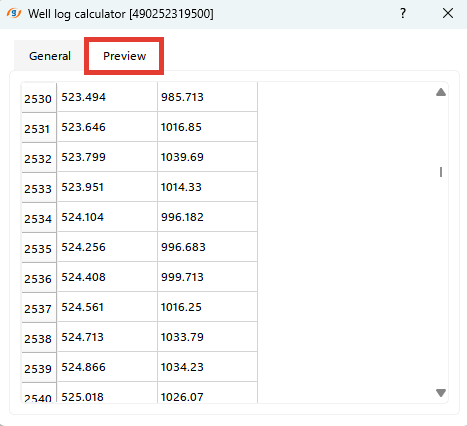
The Preview tab provides a real-time visualization of the data before finalizing the calculation. It consists of two columns:
- Depth: Displays the depth intervals for the well data in ascending or descending order.
- Values: Shows the resulting values based on the arithmetic expression entered in the General tab. This preview ensures that users can verify the output and confirm the expression before applying it to the selected well.
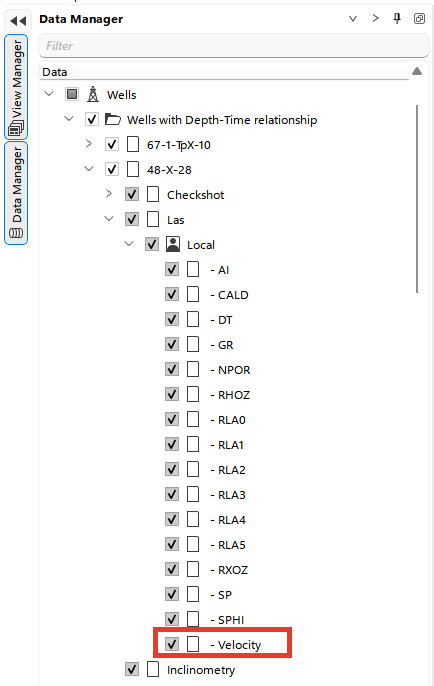
Click Apply to run the calculation. The dialog stays open, so you can create several curves in one session; close it with Cancel. Each calculation creates or updates the selected output curve in the selected well's Logs folder in the Data Manager.
Running the calculator from the Petrophysics ribbon
The Log calculator is also available from the Petrophysics ribbon tab, in the Logs group, where the button caption is shortened to Calculator. Opened this way it provides an expanded calculator interface with a built-in keypad, function buttons, a well selector and an expression history. In this interface the output curve name and the expression are typed together in the Expression field using the form name = expression (for example, NPHI_calc = ...). The part before the equals sign becomes the name of the new curve.
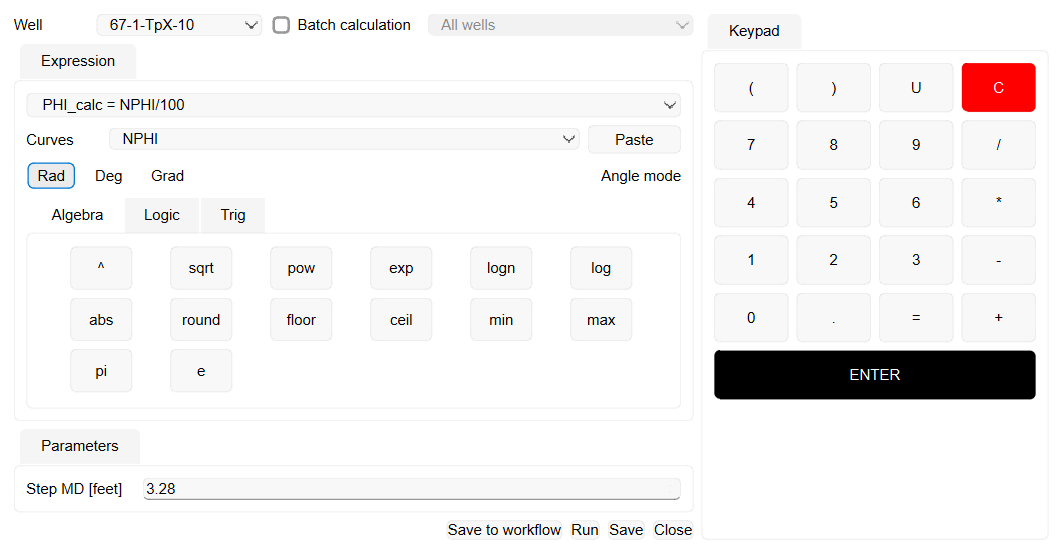
The main controls are:
- Curves and Paste — select an available curve (or MD for measured depth) and click Paste to insert its name into the expression. Use U for the undefined value.
- Algebra, Logic and Trig tabs and the keypad — insert mathematical functions, operators and digits into the expression.
- Angle mode (Rad, Deg, Grad) — sets how trigonometric functions interpret angle values.
- Step MD — the sampling interval, in depth, used to resample the input curves and store the result.
Use Run, Save or ENTER to calculate with the current settings. The dialog stays open after the calculation so you can create several curves in one session, and it does not block the rest of g-Space: while it is open you can still select another well in the Data Manager, scroll or zoom a log, map or seismic view, and use the ribbon. You can therefore check a curve you have just calculated in a view, then adjust the expression and run it again without reopening the calculator. This applies to the Log calculator only: the calculator opened from the Data Manager, and the Map calculator, Seismic calculator, Marker attributes calculator and Grid calculator, still have to be closed before you can work in the main window again. Only one Log calculator window is used at a time: while it is open, choosing Log calculator on the Petrophysics ribbon again applies the current settings to that same window instead of opening a second calculator. Use Close when you are finished. Each calculated curve is added to the well's LAS data in the Data Manager; if a curve with the same name already exists, Run and Save ask whether to replace it.
Click Save to workflow to add the expression, output curve, angle mode, depth step and selected well scope as a Log calculator job in the current workflow without running the calculation. g-Space confirms with Log calculator step saved to the current workflow., and the step appears in the Jobs panel of the Workflows wizard as Log calculator. When you open a saved job from Workflows, its settings are restored and the dialog shows Save and Cancel; use Save to update the job or Cancel to leave it unchanged.
Executing the workflow runs the calculation with the stored settings, with three differences from a run in the open dialog:
- The inputs are checked before anything is written. When the workflow reaches the step, g-Space re-checks the stored inputs against the current project. If a saved well is no longer in the project, or a target well no longer holds one of the curves the saved expression uses, the step fails with Log calculator input validation failed. followed by Missing well(s): listing each missing well and/or Missing input curve(s): listing each missing curve together with the well it is missing from. No output curve is created, and execution stops at the failed step, as described in Workflows. A run that reaches the calculation but produces no calculated well at all also fails, and reports the run report as its message.
- The saved well scope is resolved again at run time. With Batch calculation cleared, the step targets the single well that was selected when it was saved. With the All wells scope, the well list is resolved again on every run, so wells added to the project after the step was saved are included. With a named scope — a well filter, a Data Manager well folder or a well section — the step runs on the exact wells that scope resolved to when it was saved: wells that would match it now are not picked up, and any of those saved wells that have since been removed are reported by the check above.
- An existing curve is replaced without asking. A workflow run has no user present, so it overwrites a curve that already carries the output name instead of showing the confirmation.
Calculating for several wells
The well selector row at the top of the dialog controls which wells the expression is applied to:
- Well — choose a single well. By default the calculation is applied to this well only.
- Batch calculation — turn on this check box (off by default) to run the calculation on a group of wells instead of a single well. The single-well list is then disabled and the scope drop-down beside it becomes active.
- Scope drop-down — choose All wells to process every well in the project, or select a well filter, a Data Manager well folder, or a well section to limit the calculation to that group.
Click in the Well field and type any part of a well name, using letters or numbers. Matching wells appear as you type, regardless of case; choose one from the list with the mouse or keyboard. Clear the search text to show all wells again. With Batch calculation selected, type in the scope drop-down to search its displayed choices, including All wells and named scopes.
When the run finishes, g-Space reports how many wells were processed and lists any wells that were skipped, for example because an input curve was missing, the expression produced no defined values, or the output curve already existed and was not overwritten.
Undefined values
Log curves usually have gaps: depths where the curve holds the undefined value U instead of a measurement. Those samples are left out of the calculation — an undefined input is not passed to the expression as a number, so it cannot distort the result. Wherever the expression cannot produce a valid number, typically because one of the curves it uses has no value at that depth, the calculated curve is undefined there as well, so the gaps of the input curves are preserved in the result instead of being filled with meaningless values.
To handle the gaps yourself, test a sample with is_undefined, which is true where the curve has no value at the current depth. For example, if(is_undefined(NPHI), 0.15, NPHI) uses 0.15 wherever NPHI has no value and the measured value everywhere else; return U as the substituted value to keep a sample undefined. is_undefined can be used both in the Log calculator opened from the Petrophysics ribbon and in the calculator opened from the Data Manager.
Expression history
The Expression field is a drop-down that remembers the last five expressions you applied, so you can reapply a previous calculation without retyping it. The most recent expression appears at the top of the list, and duplicate entries are not repeated — select an entry to reuse it.
The history is stored separately for each project, and each calculator keeps its own list, so the Log calculator, Map calculator, Seismic calculator and Marker attributes calculator do not share expressions.