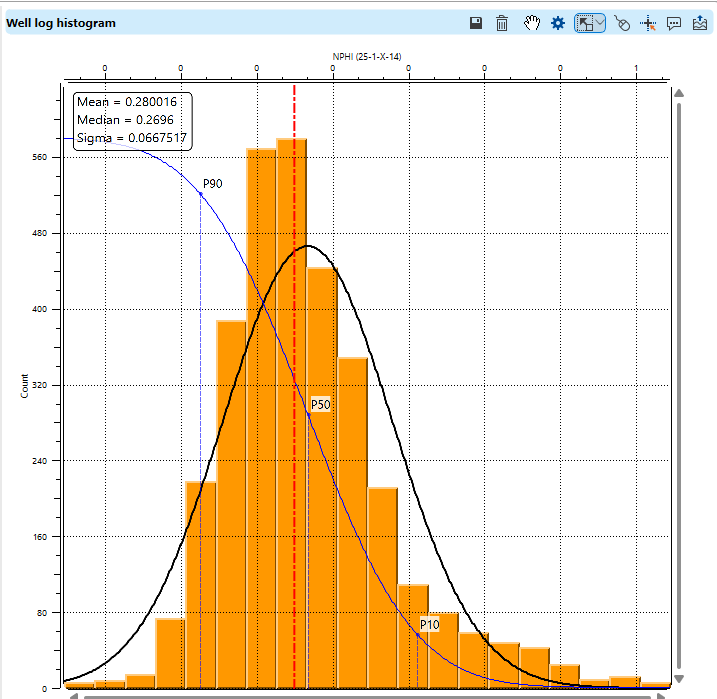
The Histogram view provides a graphical representation of the distribution of an attribute, giving users insights into the frequency and range of data values.
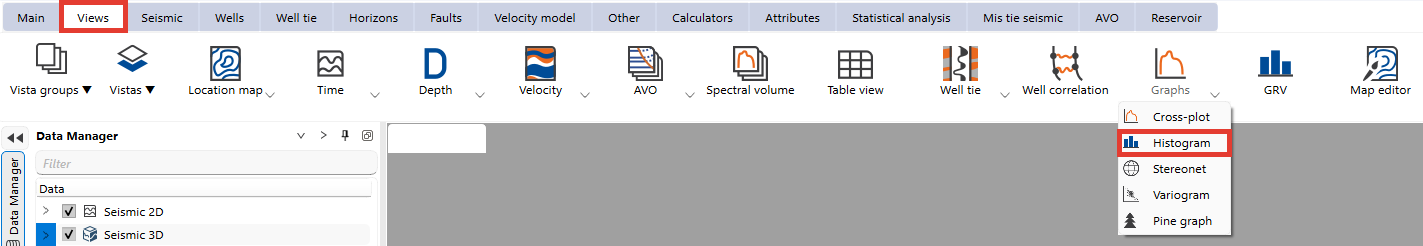
To create Histogram view go to the Views bar, navigate to Graphs and click on Histogram button:
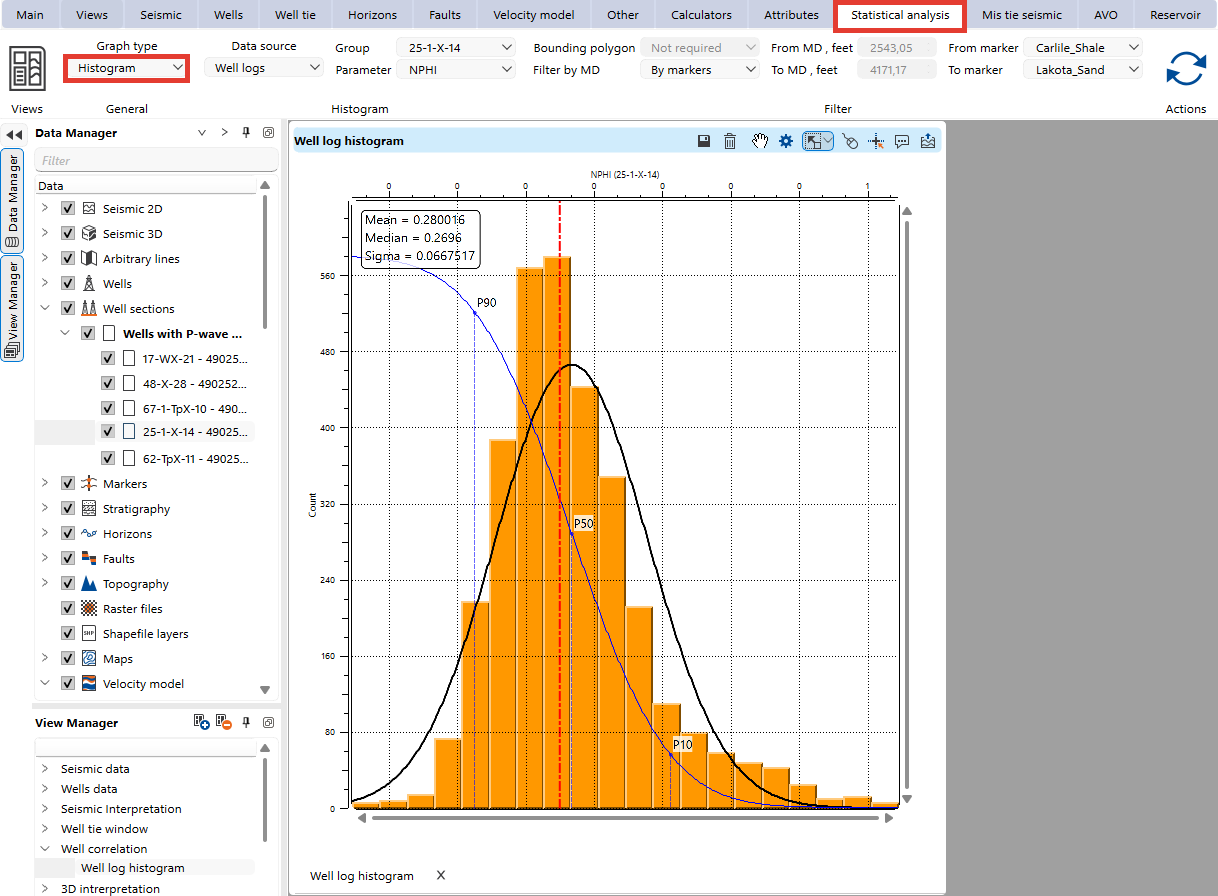
To set what data to be analyzed set parameters in the Statistical analysis bar:
Functional panel allows user to perform the following actions:
![]() open Visual Settings panel
open Visual Settings panel
![]() adjust view area to all visible objects
adjust view area to all visible objects
![]() set control item
set control item
![]() enable mouse tracker
enable mouse tracker
![]() enable tool tip
enable tool tip
![]() export picture
export picture
For more information about the Histogram analysis please refer to Statistical analysis