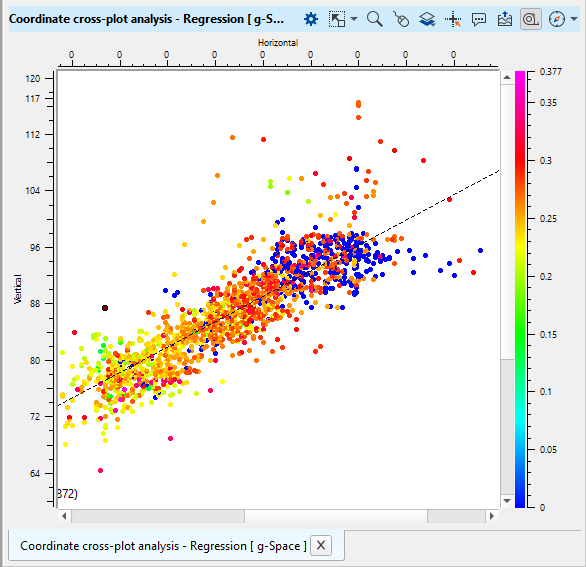
Cross plot is a view which allows user to cross-plot different data types loaded in g-Space
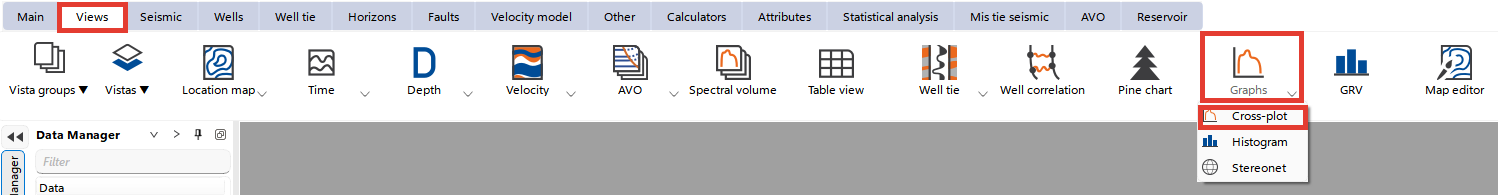
To create cross plot view go to the Views bar, navigate to Graphs and click on Cross plot button:
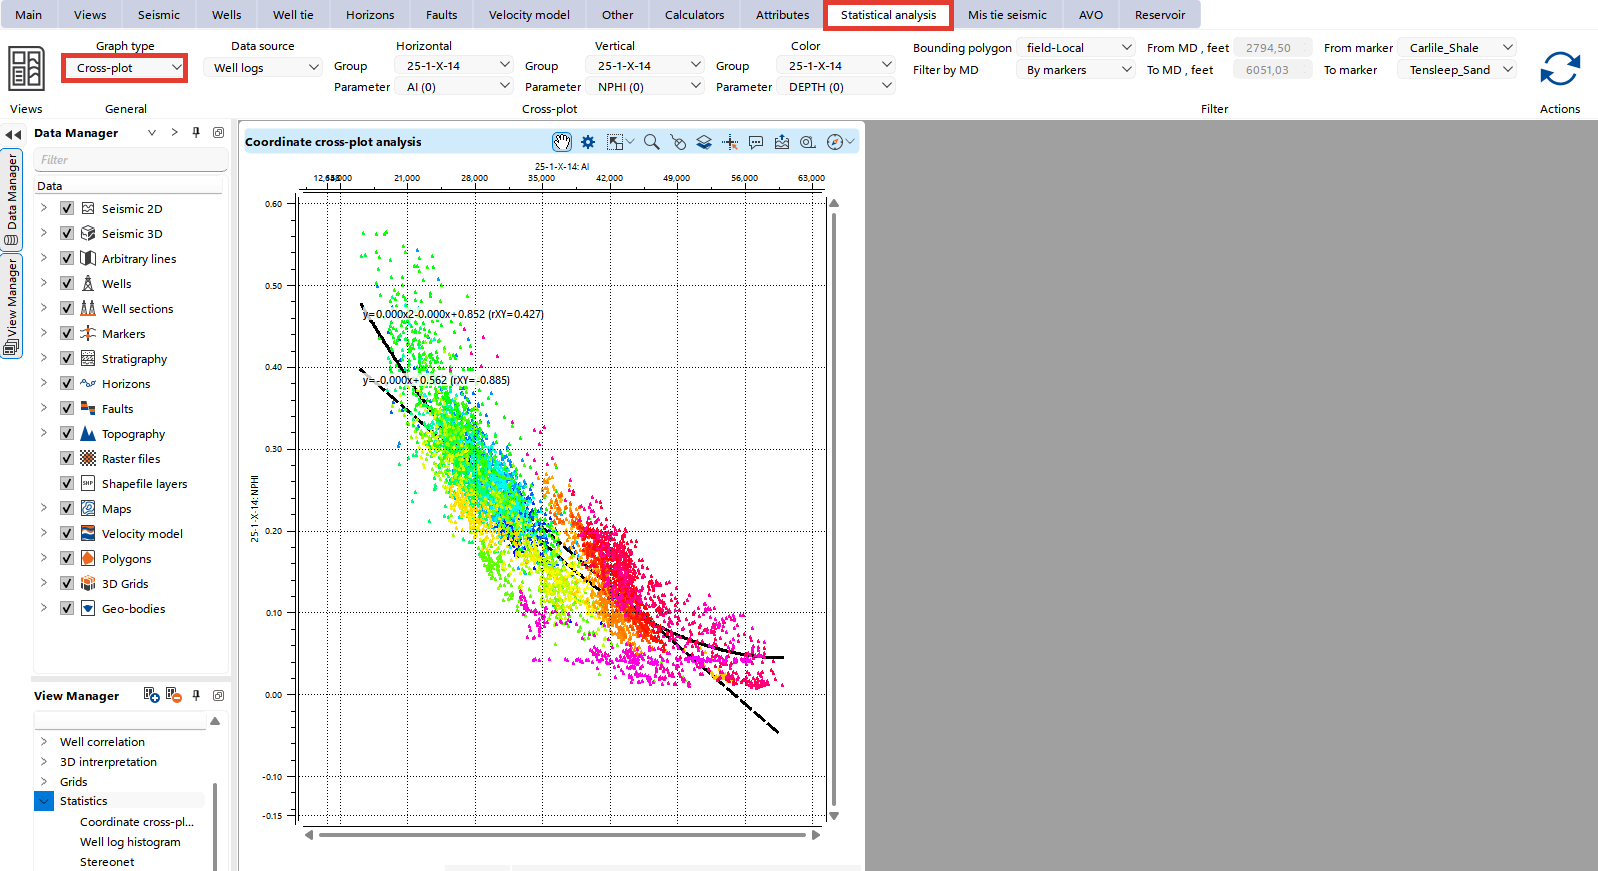
To set what data to be analyzed set parameters in the Statistical analysis bar:
To define the object visibility stile go to the Visual Settings by pressing ![]() in the view functional panel or find it in the panel sets.
in the view functional panel or find it in the panel sets.
For more information about the cross-plotting please refer to Statistical analysis
Functional panel allows user to perform the following actions:
![]() open Visual Settings panel
open Visual Settings panel
![]() adjust view area to all visible objects
adjust view area to all visible objects
![]() adjust horizontal scale
adjust horizontal scale
![]() adjust vertical scale
adjust vertical scale
![]() set/unset zoomable
set/unset zoomable
![]() set control item
set control item
![]() add Object
add Object
![]() enable mouse tracker
enable mouse tracker
![]() enable tool tip
enable tool tip
![]() export picture
export picture
![]() ruler tool
ruler tool